Chapter 7 PhD Research topic based
7.1 CNV calling
7.1.1 breaking point detection
- 4 CNV breakpoint detection methods (2021-07-17 Group meeting)
- CHISEL: https://www.nature.com/articles/s41587-020-0661-6#Sec8 (see global clustering subsection)
- seemingly no breakpoint detection, but rather a global clustering (ie. entry-wise for a bin-by-cell matrix), thus the resolution of CNV is the bin size (5MB)
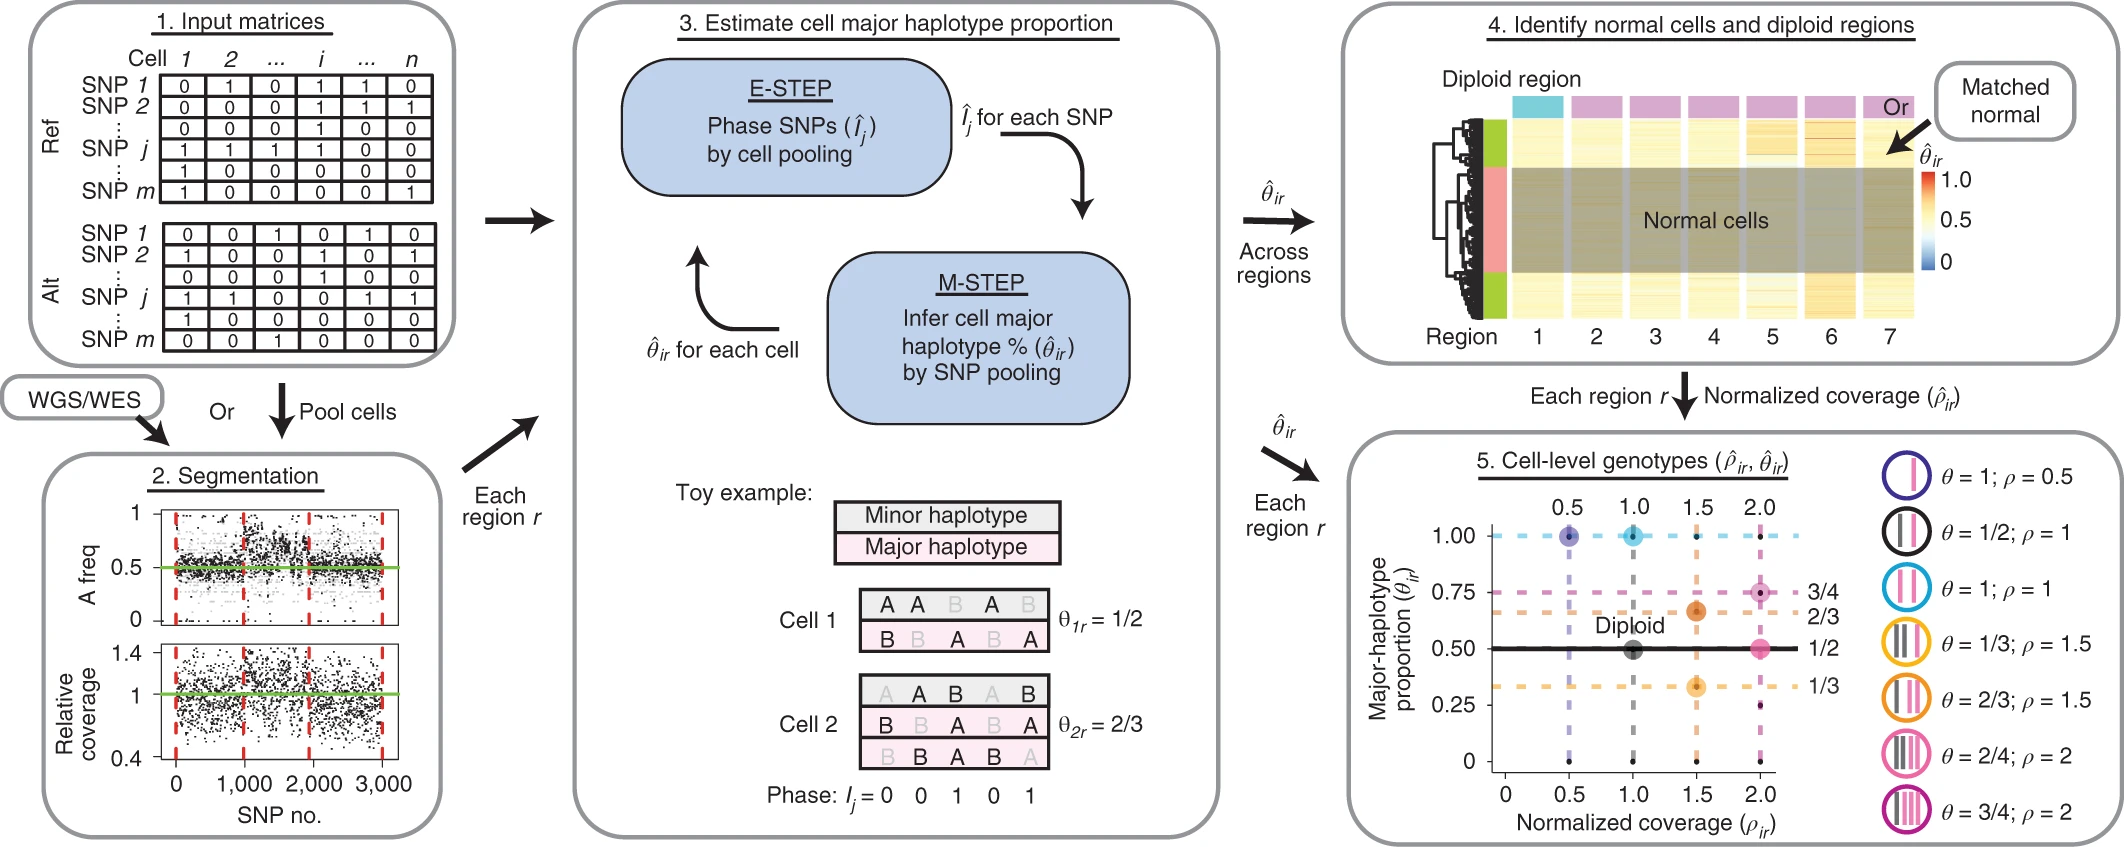
- Alleloscope: https://www.nature.com/articles/s41587-021-00911-w#Sec10 (see segmentation subsection)
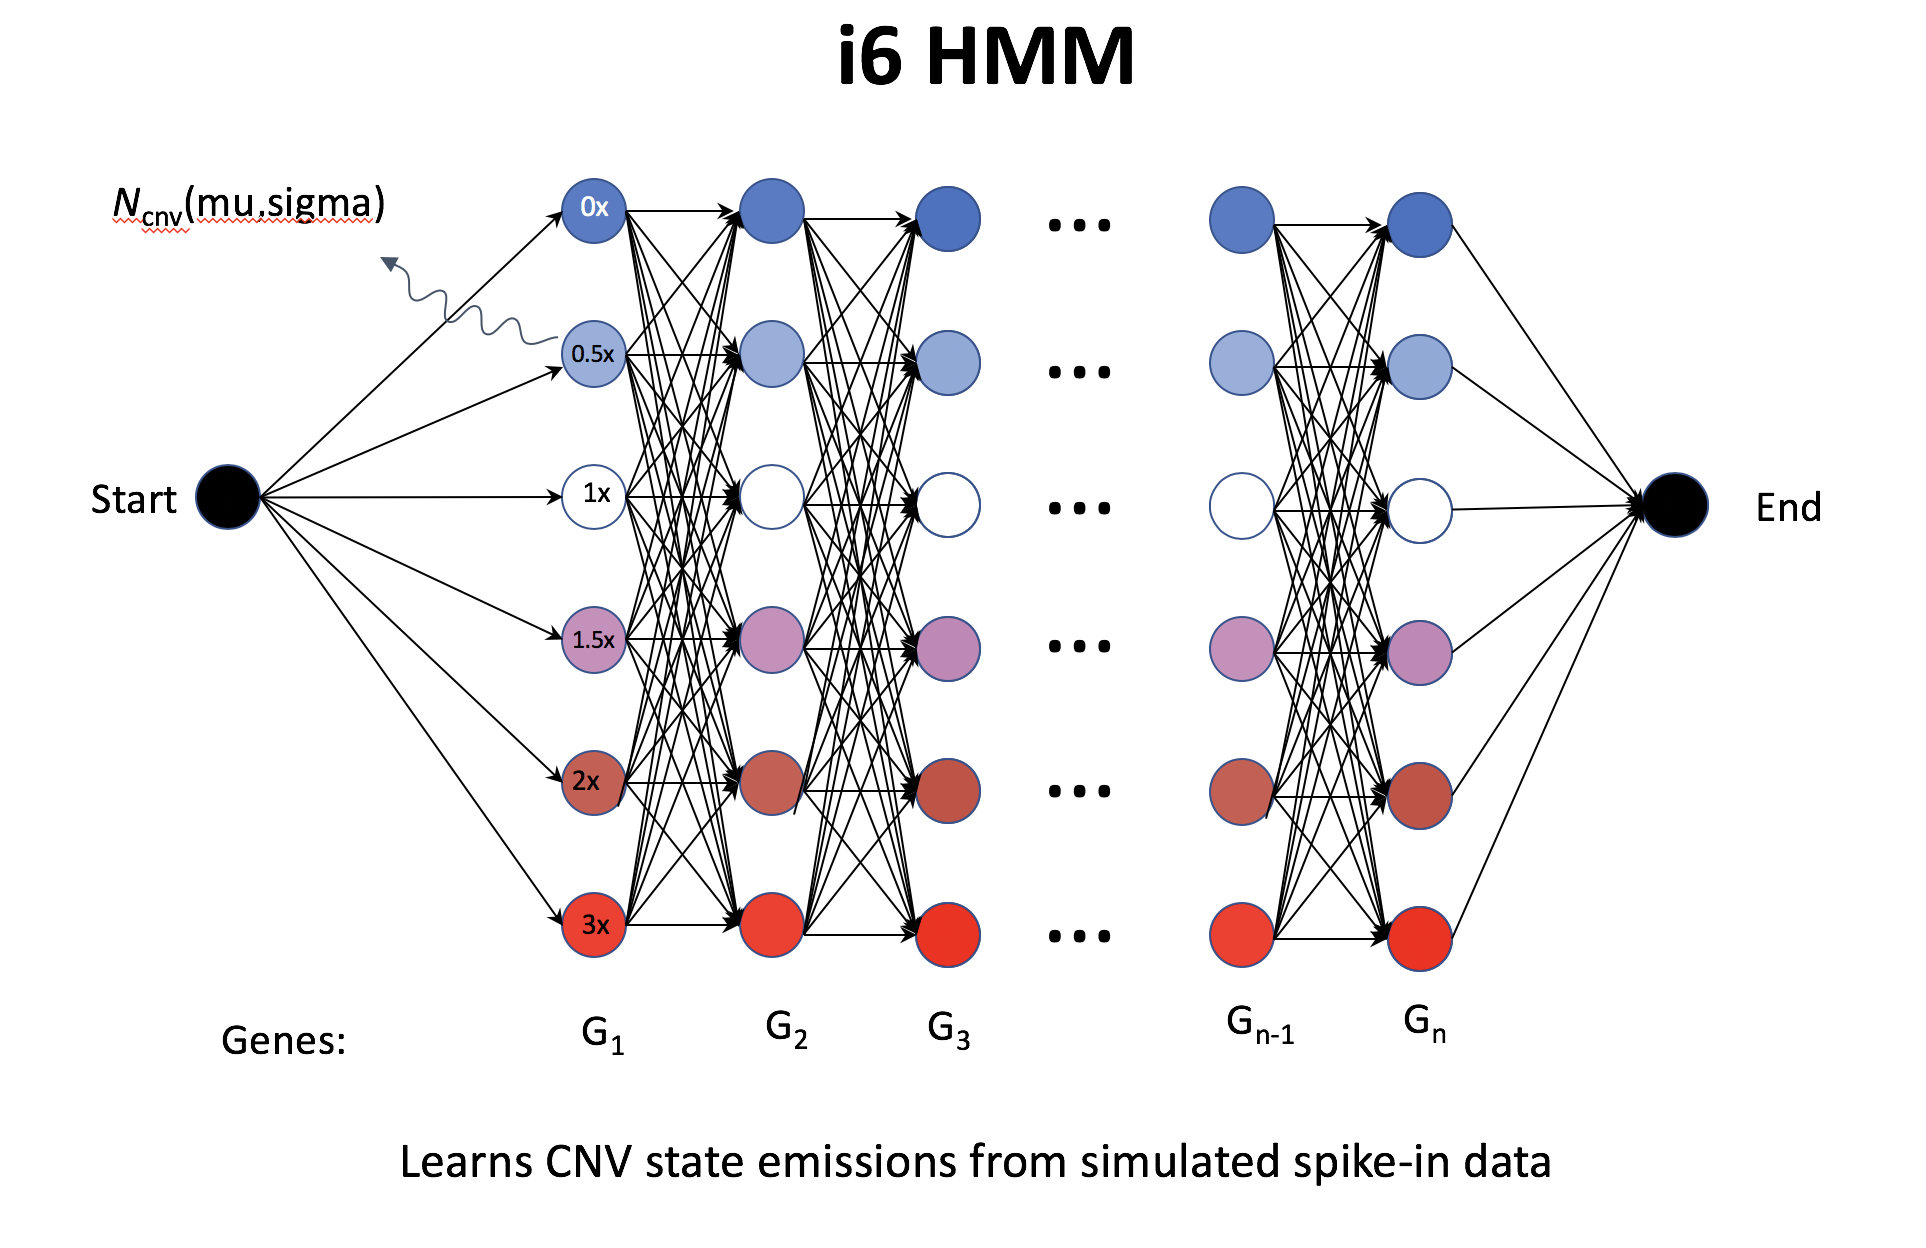
- HMM on a pooled cells (pseudo-bulk?) with pre-defined Gaussian means and variance for each state
- i6-HMM generates in silico spike-in; seemingly define CNV region (segment) on cluster instead of cell, but using noise model on each cell (not quite sure from the doc).
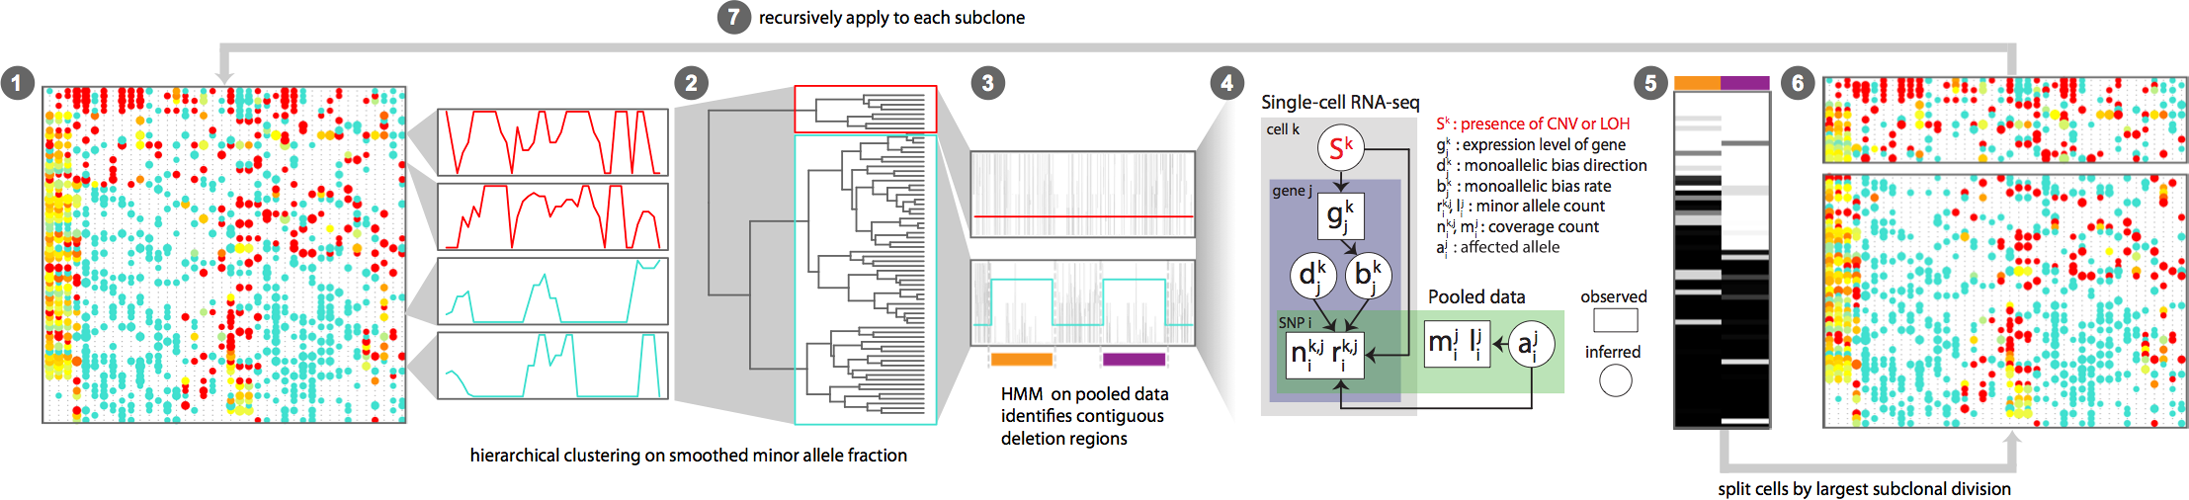
- KS test for whether to two neighbour bins should be joined, by using the posterior samples of Gamma-Poisson posterior. Seemingly using noise model on each cell within a cluster
FACLON https://academic.oup.com/nar/article/43/4/e23/2410993
https://www.nature.com/articles/s41467-020-17967-y/figures/1
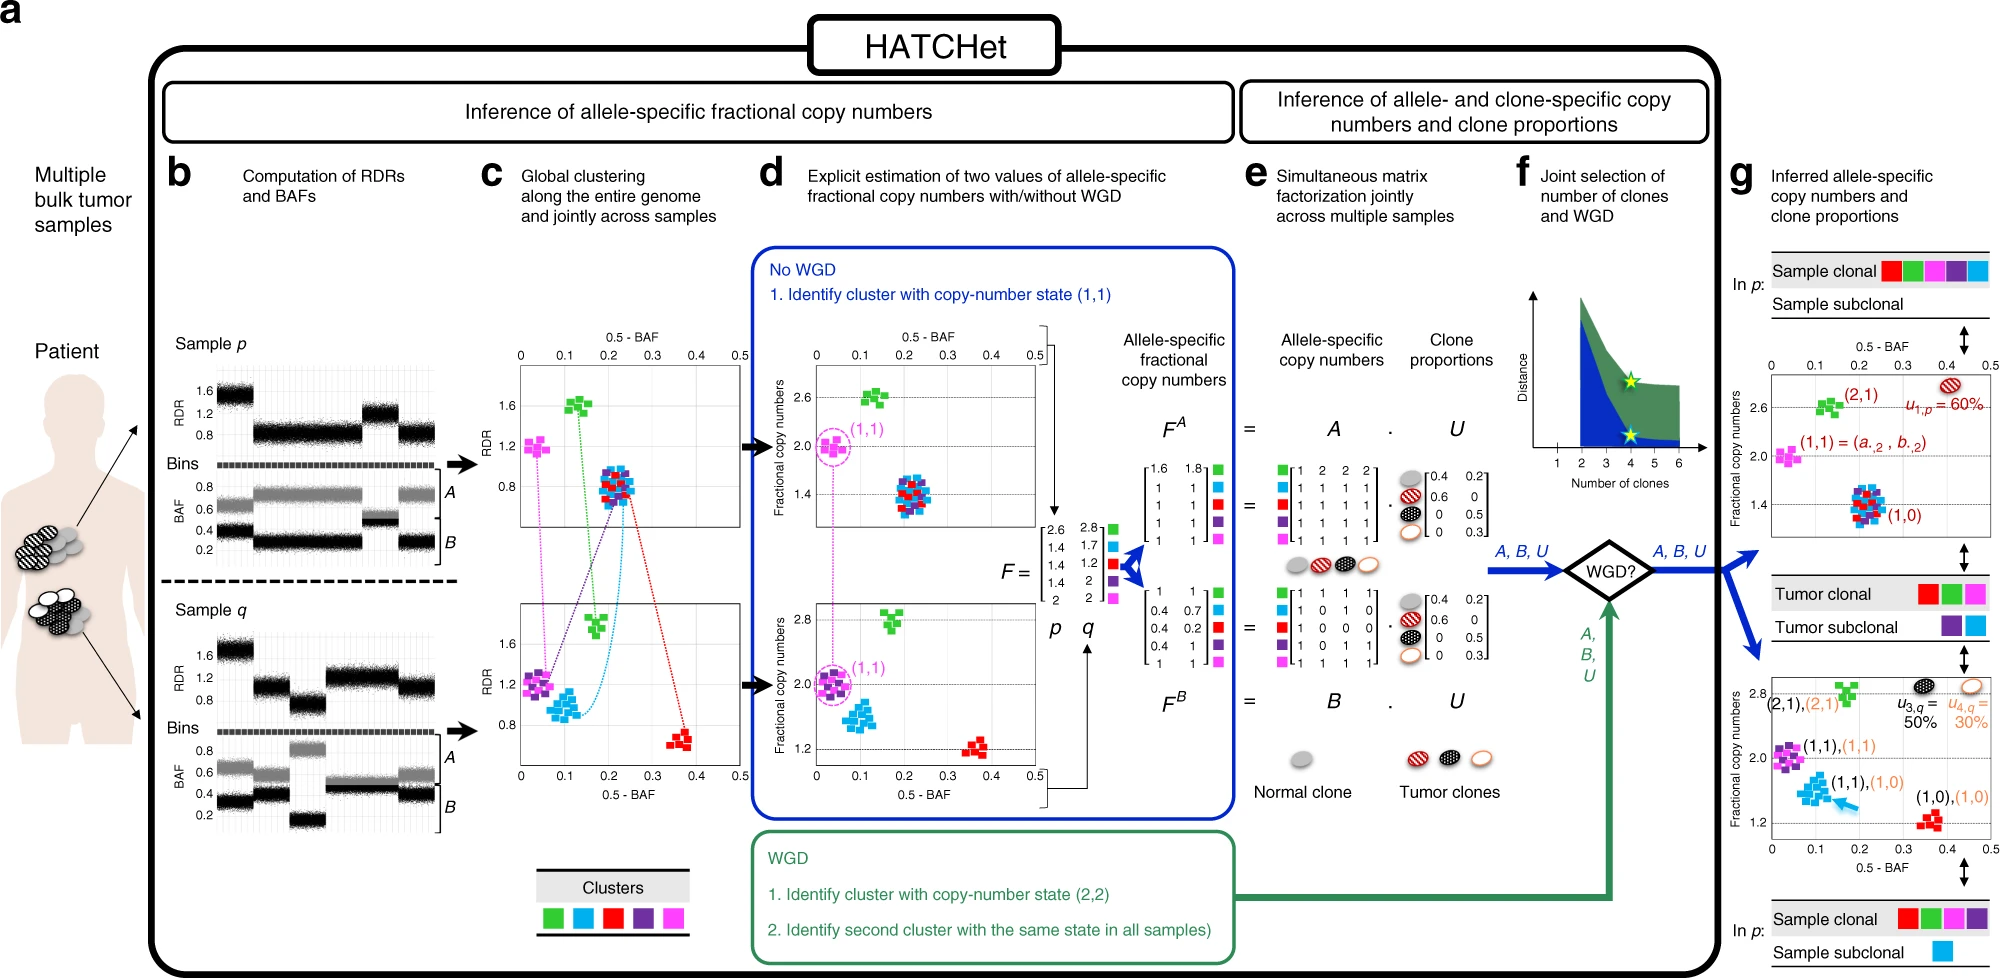
a HATCHet takes in input DNA sequencing data from multiple bulk tumor samples of the same patient and has five steps. b First, HATCHet calculates the RDRs and BAFs in bins of the reference genome (black squares). Here, we show two tumor samples p and q. c Second, HATCHet clusters the bins based on RDRs and BAFs globally along the entire genome and jointly across samples p and q. Each cluster (color) includes bins with the same copy-number state within each clone present in p or q. d Third, HATCHet estimates two values for the fractional copy number of each cluster by scaling RDRs. If there is no WGD, the identification of the cluster (magenta) with copy-number state (1, 1) is sufficient and RDRs are scaled correspondingly. If a WGD occurs, HATCHet identifies an additional cluster with identical copy-number state in all tumor clones. Dashed black horizontal lines in the scaled BAF-RDR plot represent values of fractional copy numbers that correspond to clonal CNAs. e Fourth, HATCHet factors the allele-specific fractional copy numbers FA, FB into the allele-specific copy numbers A, B, respectively, and the clone proportions U. Here, there is a normal clone and 3 tumor clones. f Last, HATCHet’s model-selection criterion identifies the matrices A, B, and U in the factorization while evaluating the fit according to both the inferred number of clones and presence/absence of a WGD. g HATCHet outputs allele- and clone-specific copy numbers (with the color of the corresponding clone) and clone proportions (in the top right part of each plot) for each sample. Clusters are classified according to the inference of unique/different copy-number states in each sample (sample-clonal/subclonal) and across all tumor clones (tumor-clonal/subclonal).
https://www.nature.com/articles/s41587-020-0661-6/figures/1
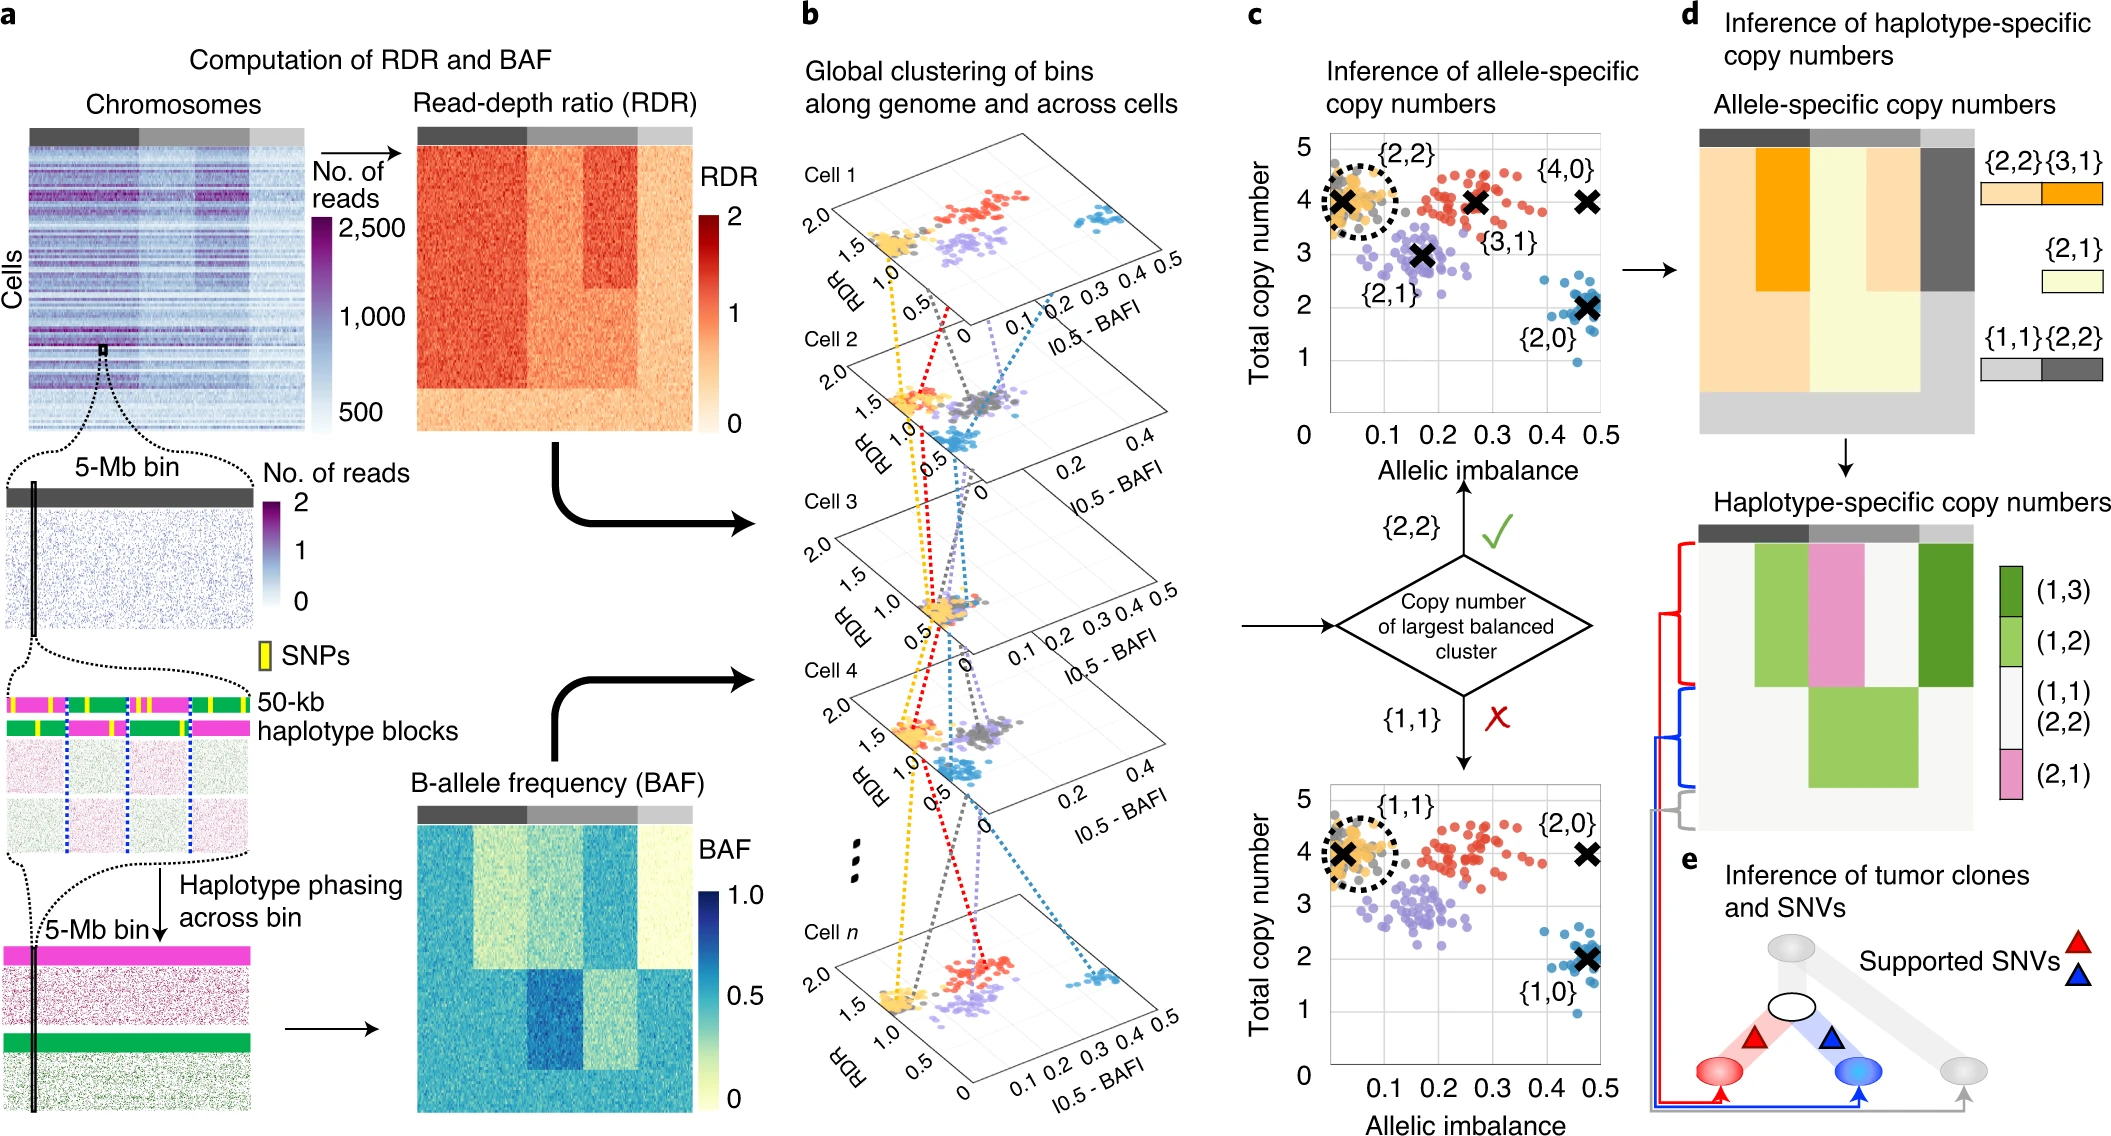
a, CHISEL computes RDRs and BAFs in low-coverage (<0.05× per cell) single-cell DNA sequencing data (top left). Read counts from 2,000 individual cells (rows) in 5-Mb genomic bins (columns) across three chromosomes (gray rectangles in first row) are shown. For each bin in each cell, CHISEL computes the RDR (top) by normalizing the observed read counts. CHISEL computes the BAF in each bin and cell (bottom) by first performing referenced-based phasing of germline SNPs in 50-kb haplotype blocks (magenta and green) and then phasing all these blocks jointly across all cells. b, CHISEL clusters RDRs and BAFs globally along the genome and jointly across all cells resulting here in five clusters of genomic bins (red, blue, purple, yellow and gray) with distinct copy-number states. c, CHISEL infers a pair {c^t,cˇt} of allele-specific copy numbers for each cluster by determining whether the allele-specific copy numbers of the largest balanced (BAF of ~0.5) cluster are equal to {1, 1} (diploid), {2, 2} (tetraploid) or are higher ploidy. d, CHISEL infers haplotype-specific copy numbers (at, bt) by phasing the allele-specific copy numbers {c^t,cˇt} consistently across all cells. e, CHISEL clusters tumor cells into clones according to their haplotype-specific copy numbers. Here, a diploid clone (light gray) and two tumor clones (red and blue) are obtained. A phylogenetic tree describes the evolution of these clones. Somatic SNVs are derived from pseudo-bulk samples and placed on the branches of the tree.
7.1.2 Related research
clonealign: statistical integration of independent single-cell RNA and DNA sequencing data from human cancers
However, independently sampled single-cell measurements introduce a new analytical challenge of how to associate cells across each modality. Assuming a population structure with a fixed number of clones, this can be expressed as a mapping problem, whereby cells measured with transcriptome assays must be aligned to those measured with a genome assay.
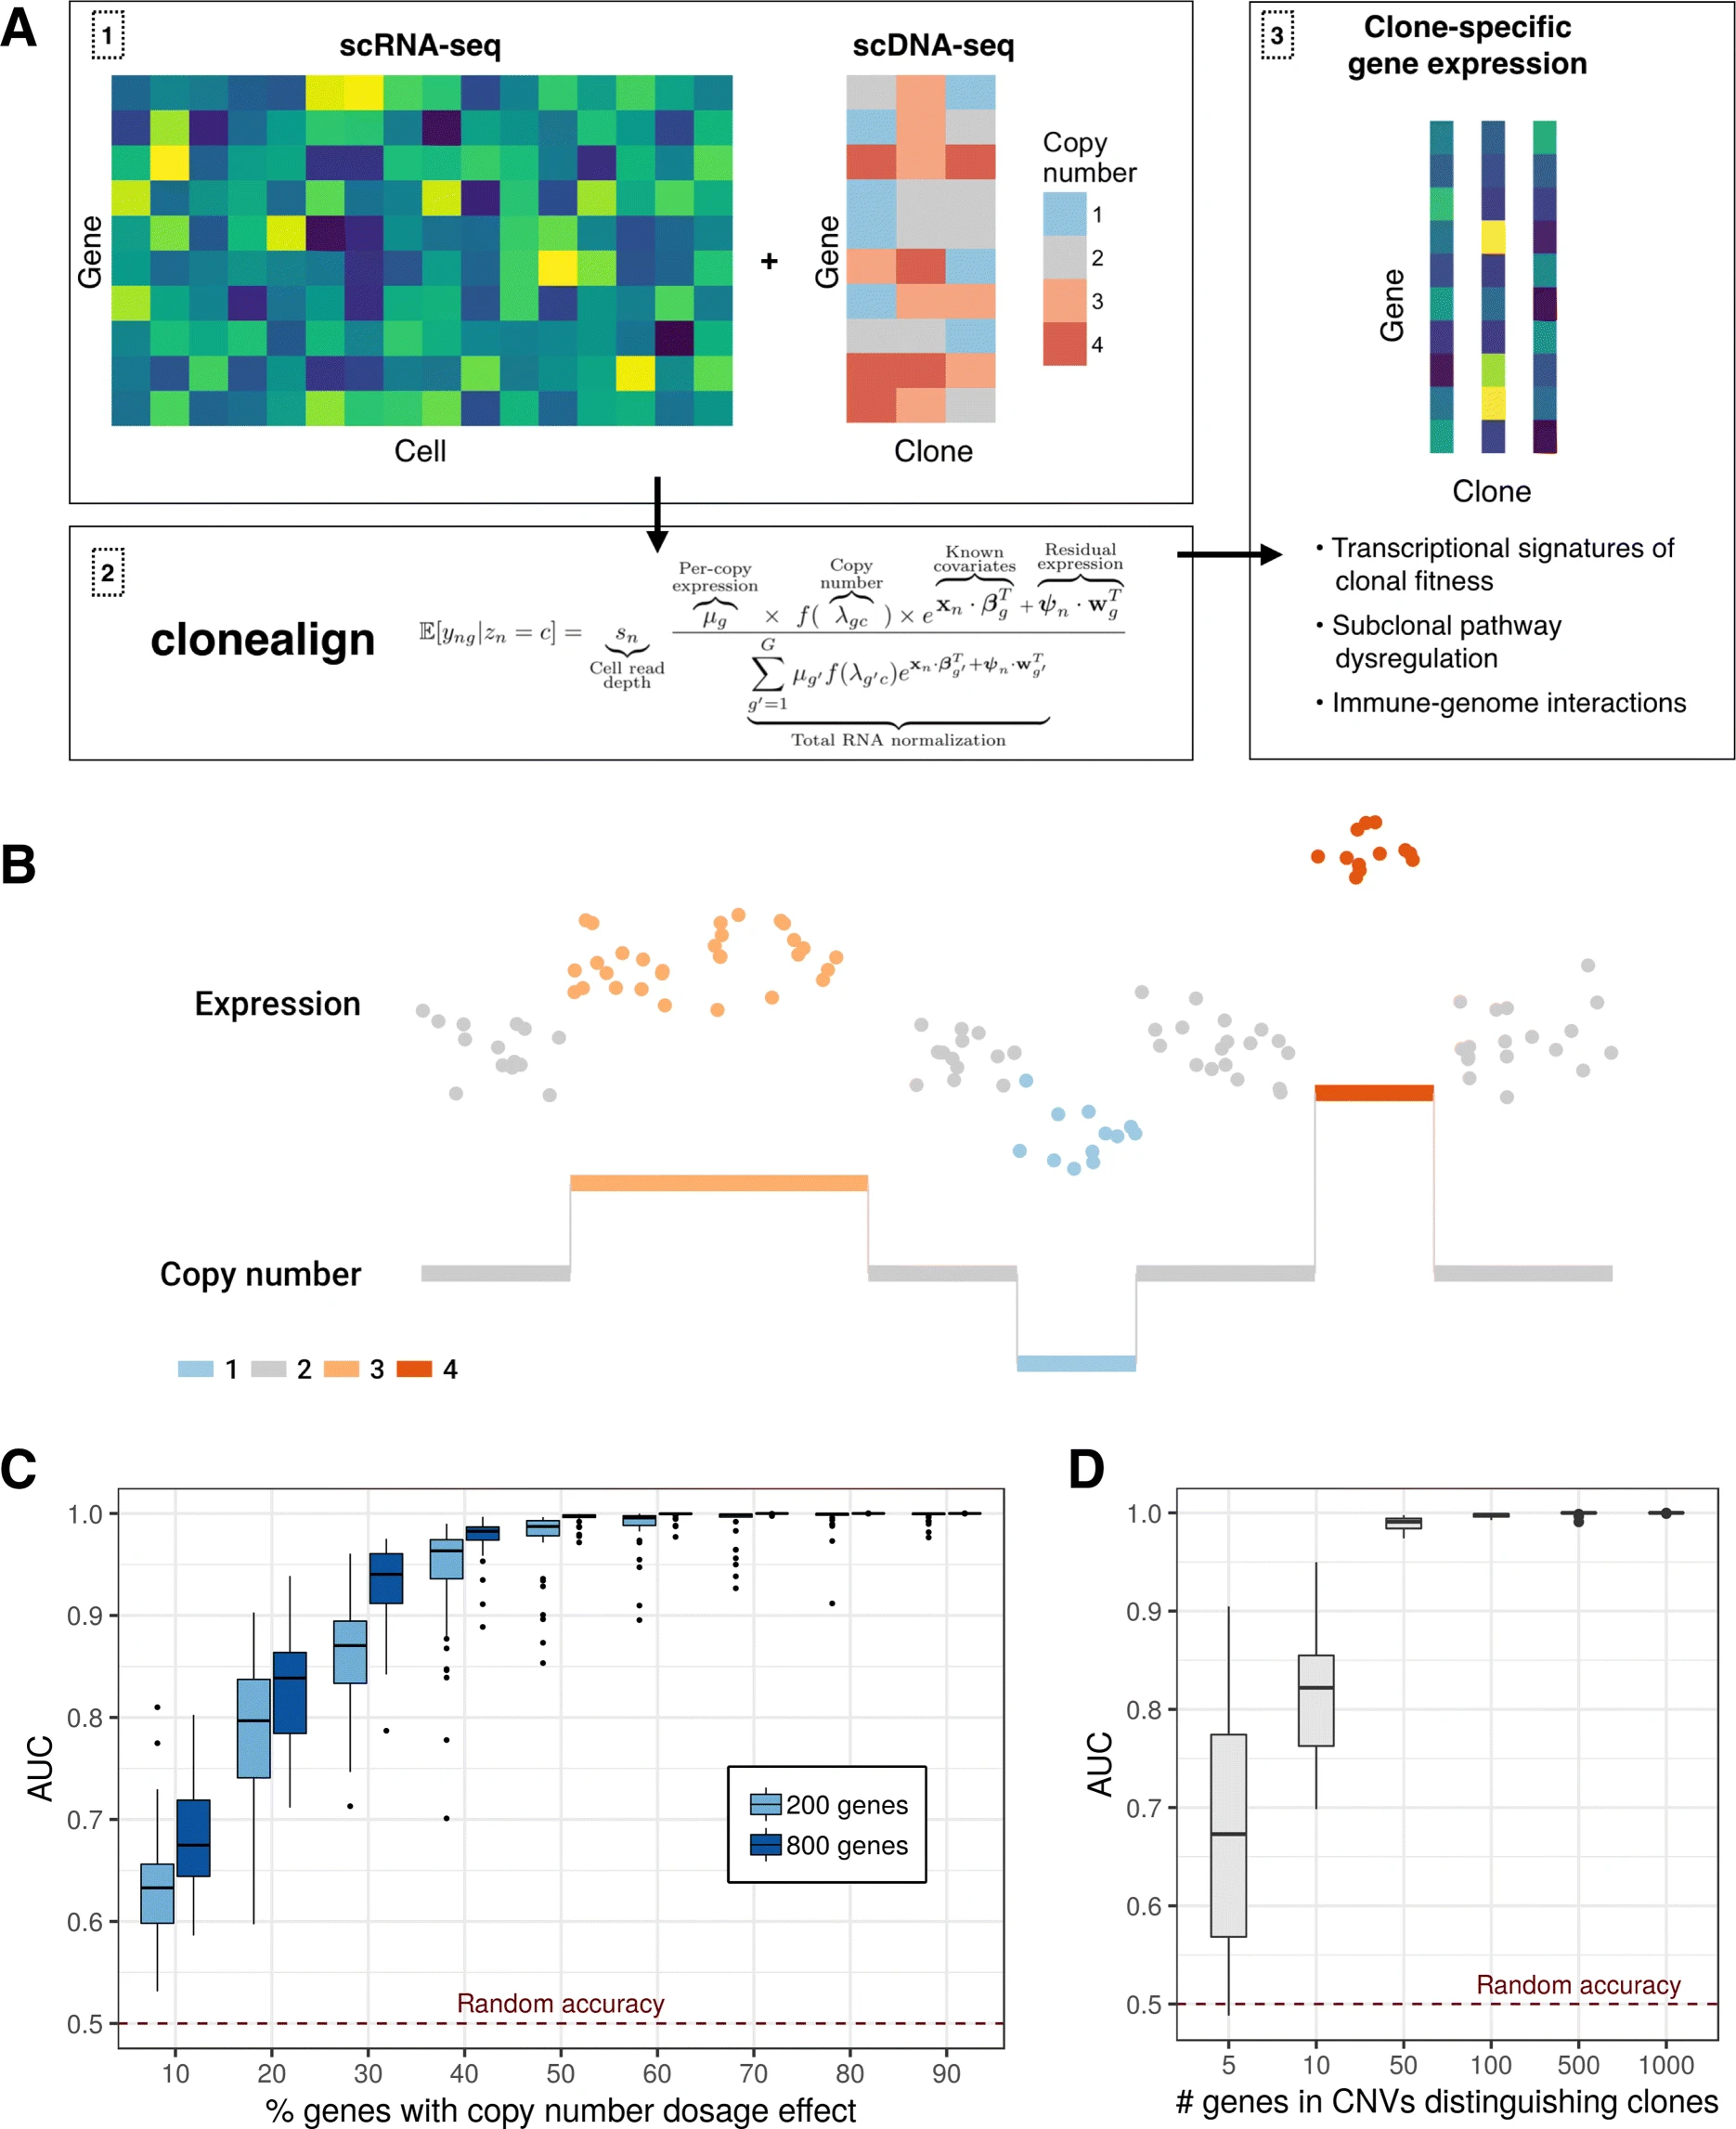 In order to relate the independent measurements, we assume that an increase in the copy number of a gene will result in a corresponding increase in that gene’s expression and vice versa (Fig. 1b)
a relationship previously observed in joint RNA-DNA assays in bulk tissues [12] and at the single-cell level [9, 10, 13].
In order to relate the independent measurements, we assume that an increase in the copy number of a gene will result in a corresponding increase in that gene’s expression and vice versa (Fig. 1b)
a relationship previously observed in joint RNA-DNA assays in bulk tissues [12] and at the single-cell level [9, 10, 13].
CHISEL
inferCNV
copyKAT
CaSpER
HoneyBADGER
7.1.4 PUBMON
Precise identification of cancer cells from allelic imbalances in single cell transcriptomes
this paper used BAF information to identify cancer cells, seems quite relevant.
2022-03-09
Evolutionary tracking of cancer haplotypes at single-cell resolution
Haplotype-enhanced inference of somatic copy number profiles from single-cell transcriptomes
Numbat
introduction
Existing approaches for CNV detection from scRNA-seq do not utilize the prior knowledge of haplotypes, or the individual-specific configuration of variant alleles on the two homologous chromosomes, which can enable more sensitive detection of allelic imbalance.
The utility of phasing in detecting CNV signals from scRNA-based assays, however, has not been explored.
We therefore developed a computational method, Numbat, which integrates expression, allele, and haplotype information derived from population-based phasing to comprehensively characterize the CNV landscape in single-cell transcriptomes.
Numbat does not require sample-matched DNA data or a priori genotyping, and is widely applicable to a wide range of experimental settings and cancer types.
- Results
Enhanced detection of subclonal allelic imbalances using population-based haplotype phasing
Prior phasing information can effectively amplify weak allelic imbalance signals of individual SNPs induced by the CNV, by exposing joint behavior of entire haplotype sequences and thereby increasing the statistical power.
The ability to infer phasing between genes is particularly useful for CNV inference, as it provides means to overcome stochastic allele-specific expression effects which give rise to bursts of gene-specific allelic imbalances in individual cells.
The differential phasing accuracy from within and between genes reflects the fact that the strength of genetic linkage decays with increasing distance (Supplementary Figure 1a).
To reflect the decay in phasing strength over longer genetic distances, we introduced site-specific transition probabilities between haplotype states in the Numbat allele HMM (see Methods).
Accurate copy number inference from single-cell transcriptomes
To increase robustness, Numbat models gene expression as integer read counts using a discrete Poisson Lognormal mixture distribution, and accounts for excess variance in the allele frequency (e.g. due to allele-specific detection or transcriptional bursts) using a Beta-Binomial distribution.
Iterative strategy to decompose tumor clonal architecture
Reliable identification of cancer cells in the tumor microenvironment
Allele-specific CNV analysis reveals additional subclonal complexity
Unraveling the interplay between genetic and transcriptional heterogeneity in tumor evolution
Discussion
Methods
7.3 Deconvolution
7.3.1 Deconvolution of bulk tissue and spatial transcriptomic data
Related papers are as follows:
From xiunan’s pre
Reference-free cell-type deconvolution of pixel-resolution spatially resolved transcriptomics data
Yuanhua add
7.5 Spatial transcriptomics
- 202109 Read in depth (lead by xianjie)
The spatial landscape of clonal somatic mutations in benign and malignant tissue(Erickson et al. 2021)
Keywords: CNV
Multimodal analysis of composition and spatial architecture in human squamous cell carcinoma(Zhang et al. 2021)
Keywords: alignment of scRNA AND ST
- 2022 spatial and CNV
Statistical and machine learning methods for spatially resolved transcriptomics data analysis(Zeng et al. 2022)
STARCH: copy number and clone inference from spatial transcriptomics data(Elyanow et al. 2021)
The spatial landscape of clonal somatic mutations in benign and malignant tissue(Erickson et al. 2021)
Keywords: spatial; CNV
- 202409 Review
Spatiotemporal omics for biology and medicine(Liu et al. 2024)
Keywords: spatial tech
This review offers an updated overview of how spatial omics has advanced our understanding of the translation of genetic information into cellular heterogeneity and tissue structural organization and their dynamic changes over time. It emphasizes the discovery of various biological phenomena, related to organ functionality, embryogenesis, species evolution, and the pathogenesis of diseases.
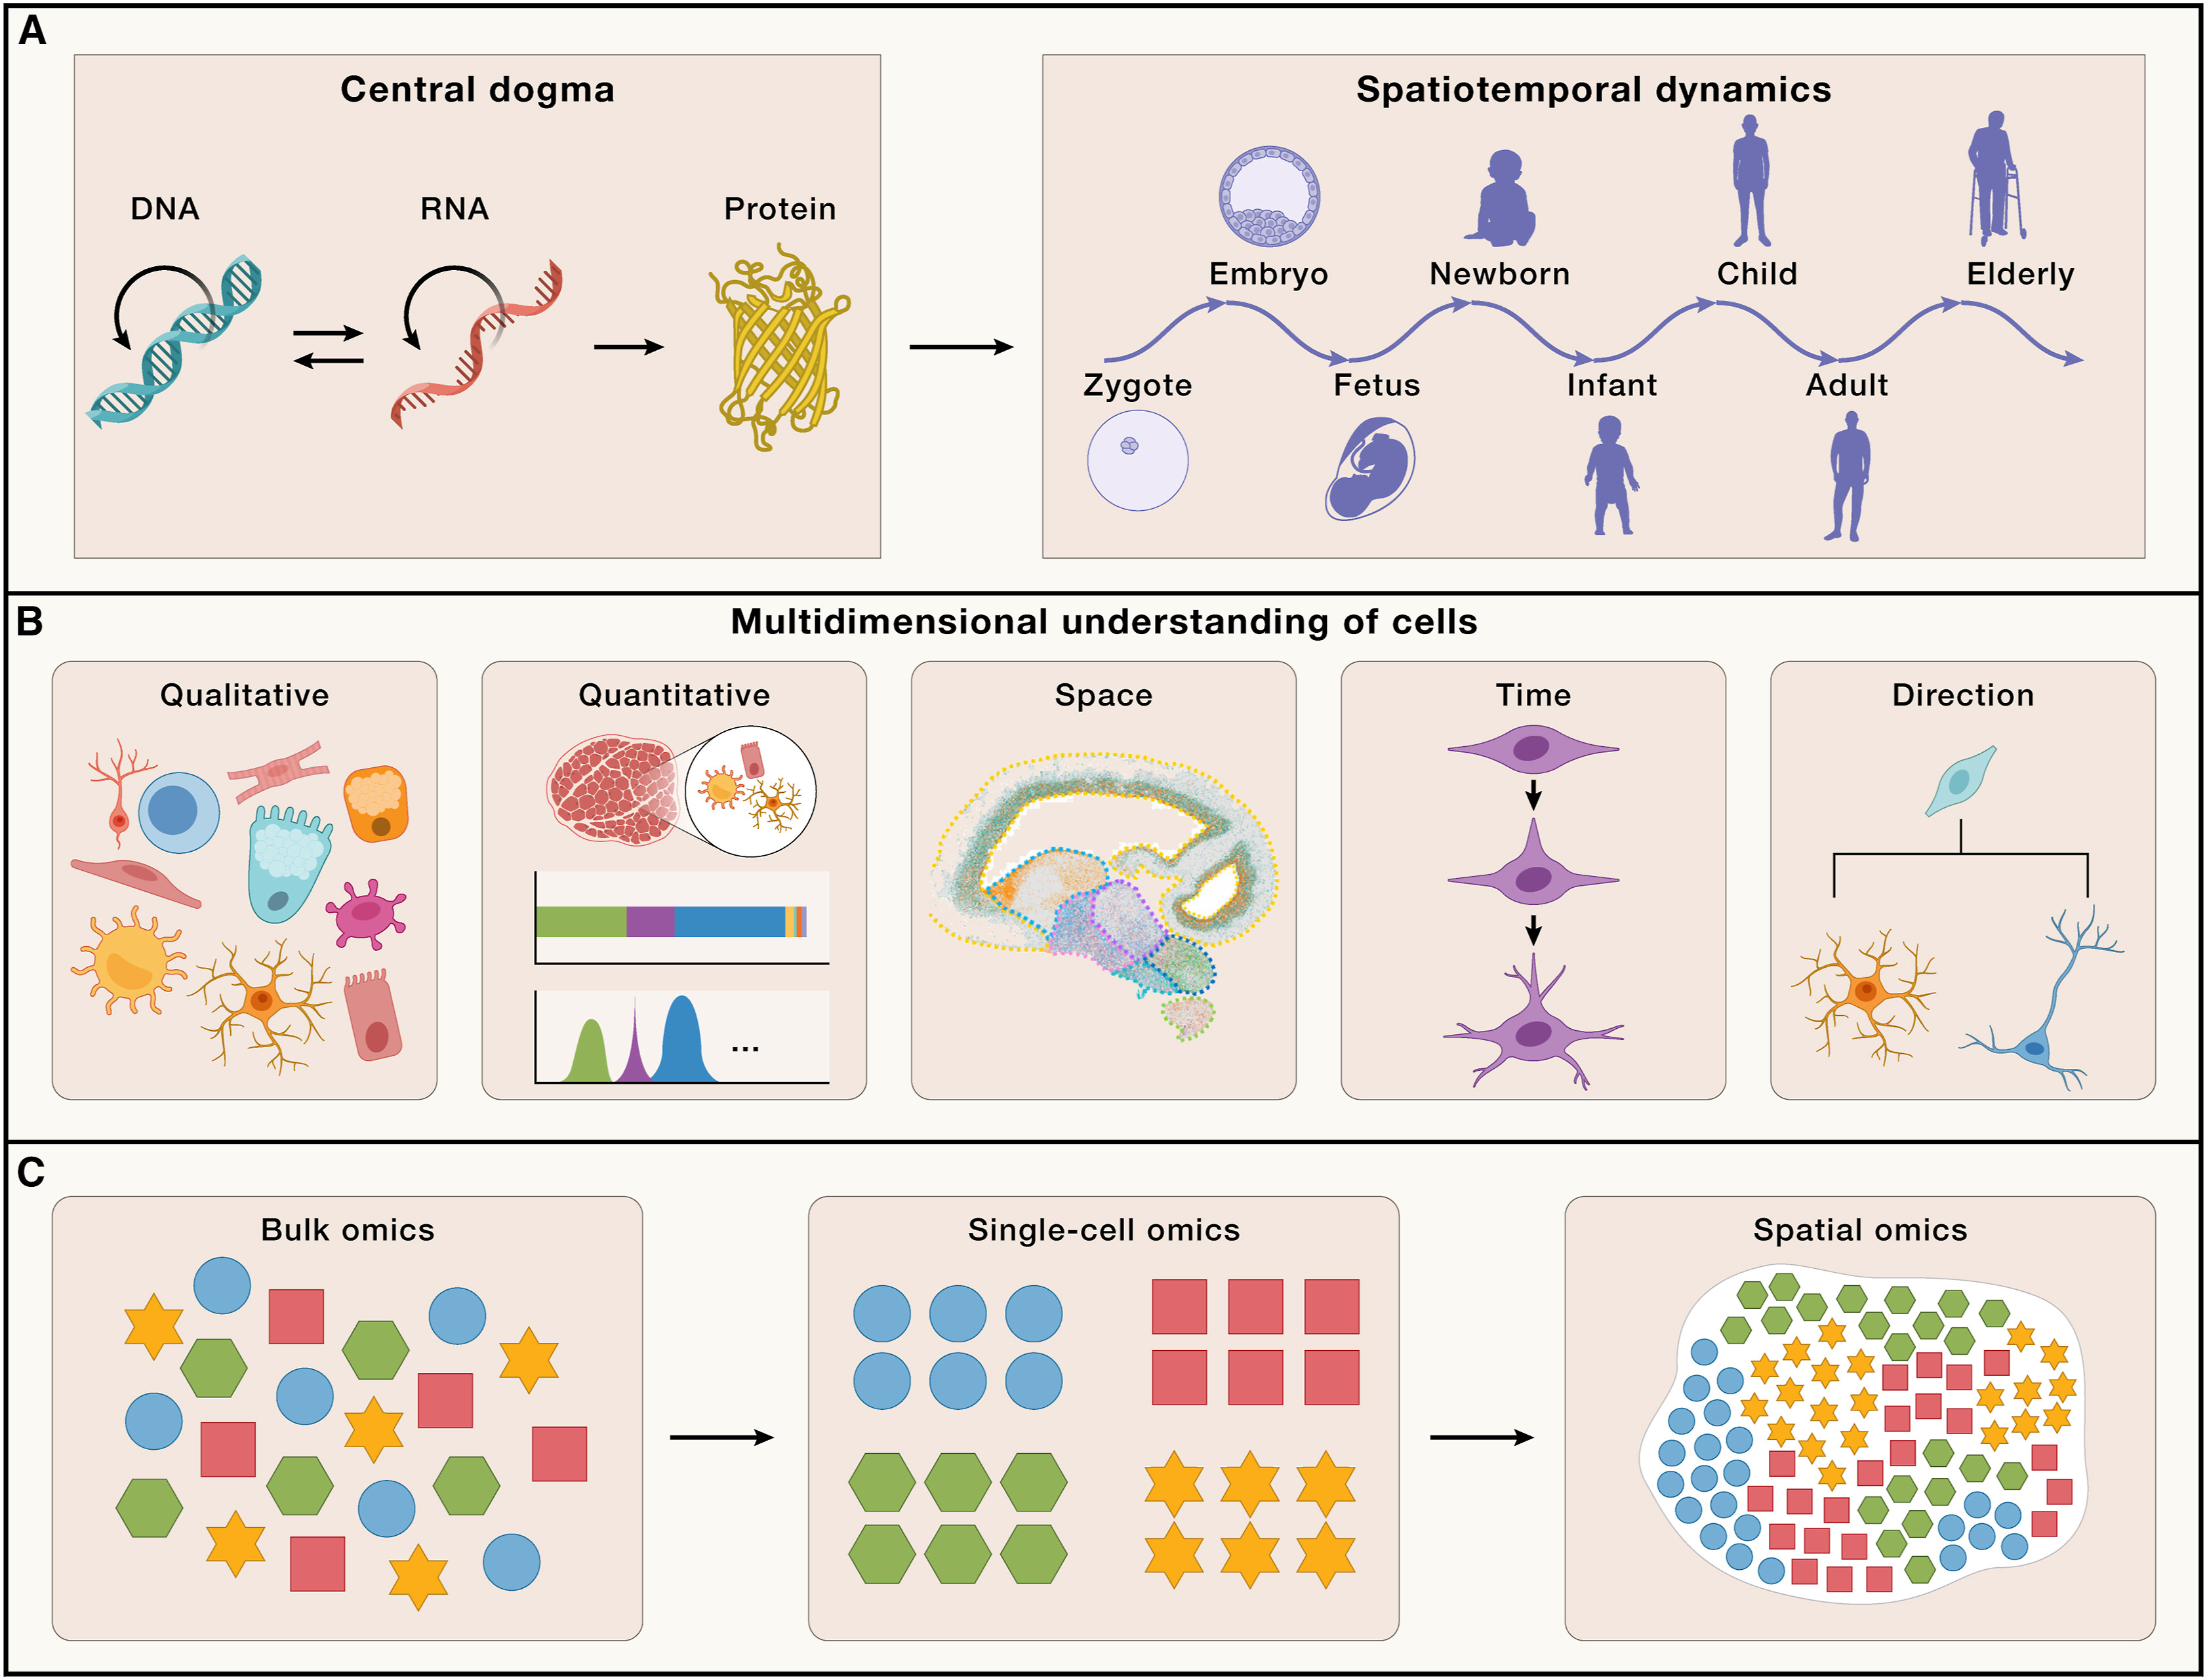
However, a critical question remains about how these variants influence the functions of specific organs or cells. Addressing these challenges necessitates a comprehensive understanding of how molecular-level sequence information translates to a single cell within a network of communicating and interacting cells that form functional biological systems. This encompasses (1) qualitative-the diversity of cell types generated through the regulation of gene expression; (2) quantitative-the count, proportion, and density of each cell type; (3) space-the spatial arrangement of each cell type and their interactions and cellular ecosystem; (4) time-the specific timing of changes in cell types and states; and (5) direction-the potential transformational paths each cell type may undergo (Figure 1B).
Understanding these multifaceted dimensions of cellular diversity and organization is crucial for comprehending the connections between the genome and specific biological processes, as well as the regulatory mechanisms involved.
The advances of sequencing technologies, particularly the massively parallel sequencing technology, has enabled large-scale, genome-wide multi-omics analyses of tissues. These methods have revealed pronounced tissue and cell specificity in genetic transcription. However, multi-omics analyses based on bulk tissue primarily capture average-level signals, failing to fully comprehend the heterogeneity of different cell types within tissues. The emergence of single-cell sequencing technology in 2009, and its rapid development in terms of throughput, cost, and multimodal capabilities, has provided unprecedented tools for understanding the cellular heterogeneity within tissues. Currently, single-cell omics enables the definition of cell types and states across multiple dimensions, including genomic, transcriptomic, epigenomic, and proteomic profiles. This has become a crucial technological means for answering how genomic information is transcribed and channeled into specific cell-type information. However, it remains challenging to get a good representation of all tissue-resident cell types and cell states. In particular, the capture of rare cells requires a large number of analyzed cells (unbiased) or cell-selection (biased) approaches to reach the level of statistical power to compare between cell types. Furthermore, the specific spatial context of cells within tissues, forming organs with distinct functions, poses additional complexity. Traditional imaging methods, such as X-rays, computed tomography (CT) scans, and magnetic resonance imaging (MRI) scans, have enabled visualization of the three-dimensional (3D) structure of tissues and organs but lack molecular and cellular resolution. Immunohistochemistry (IHC) or in situ hybridization (ISH) allow for spatial localization of specific genes or proteins but can only detect a limited number of targets. Recent developments in spatial omics technologies address these limitations by providing solutions for acquiring high content omics data on tissues while retaining spatial localization information. Spatial omics technologies enable comprehensive mapping of cellular composition, localization, cell-cell interactions, and spatial dynamics of cellular ecosystems (Figure 1C). From a functional perspective, these variables are essential for understanding morphogenesis during development, the structure of different organs, and their subsequent functionality and cellular microenvironment changes associated with disease processes.
7.5.1 An overview of spatial omics methods
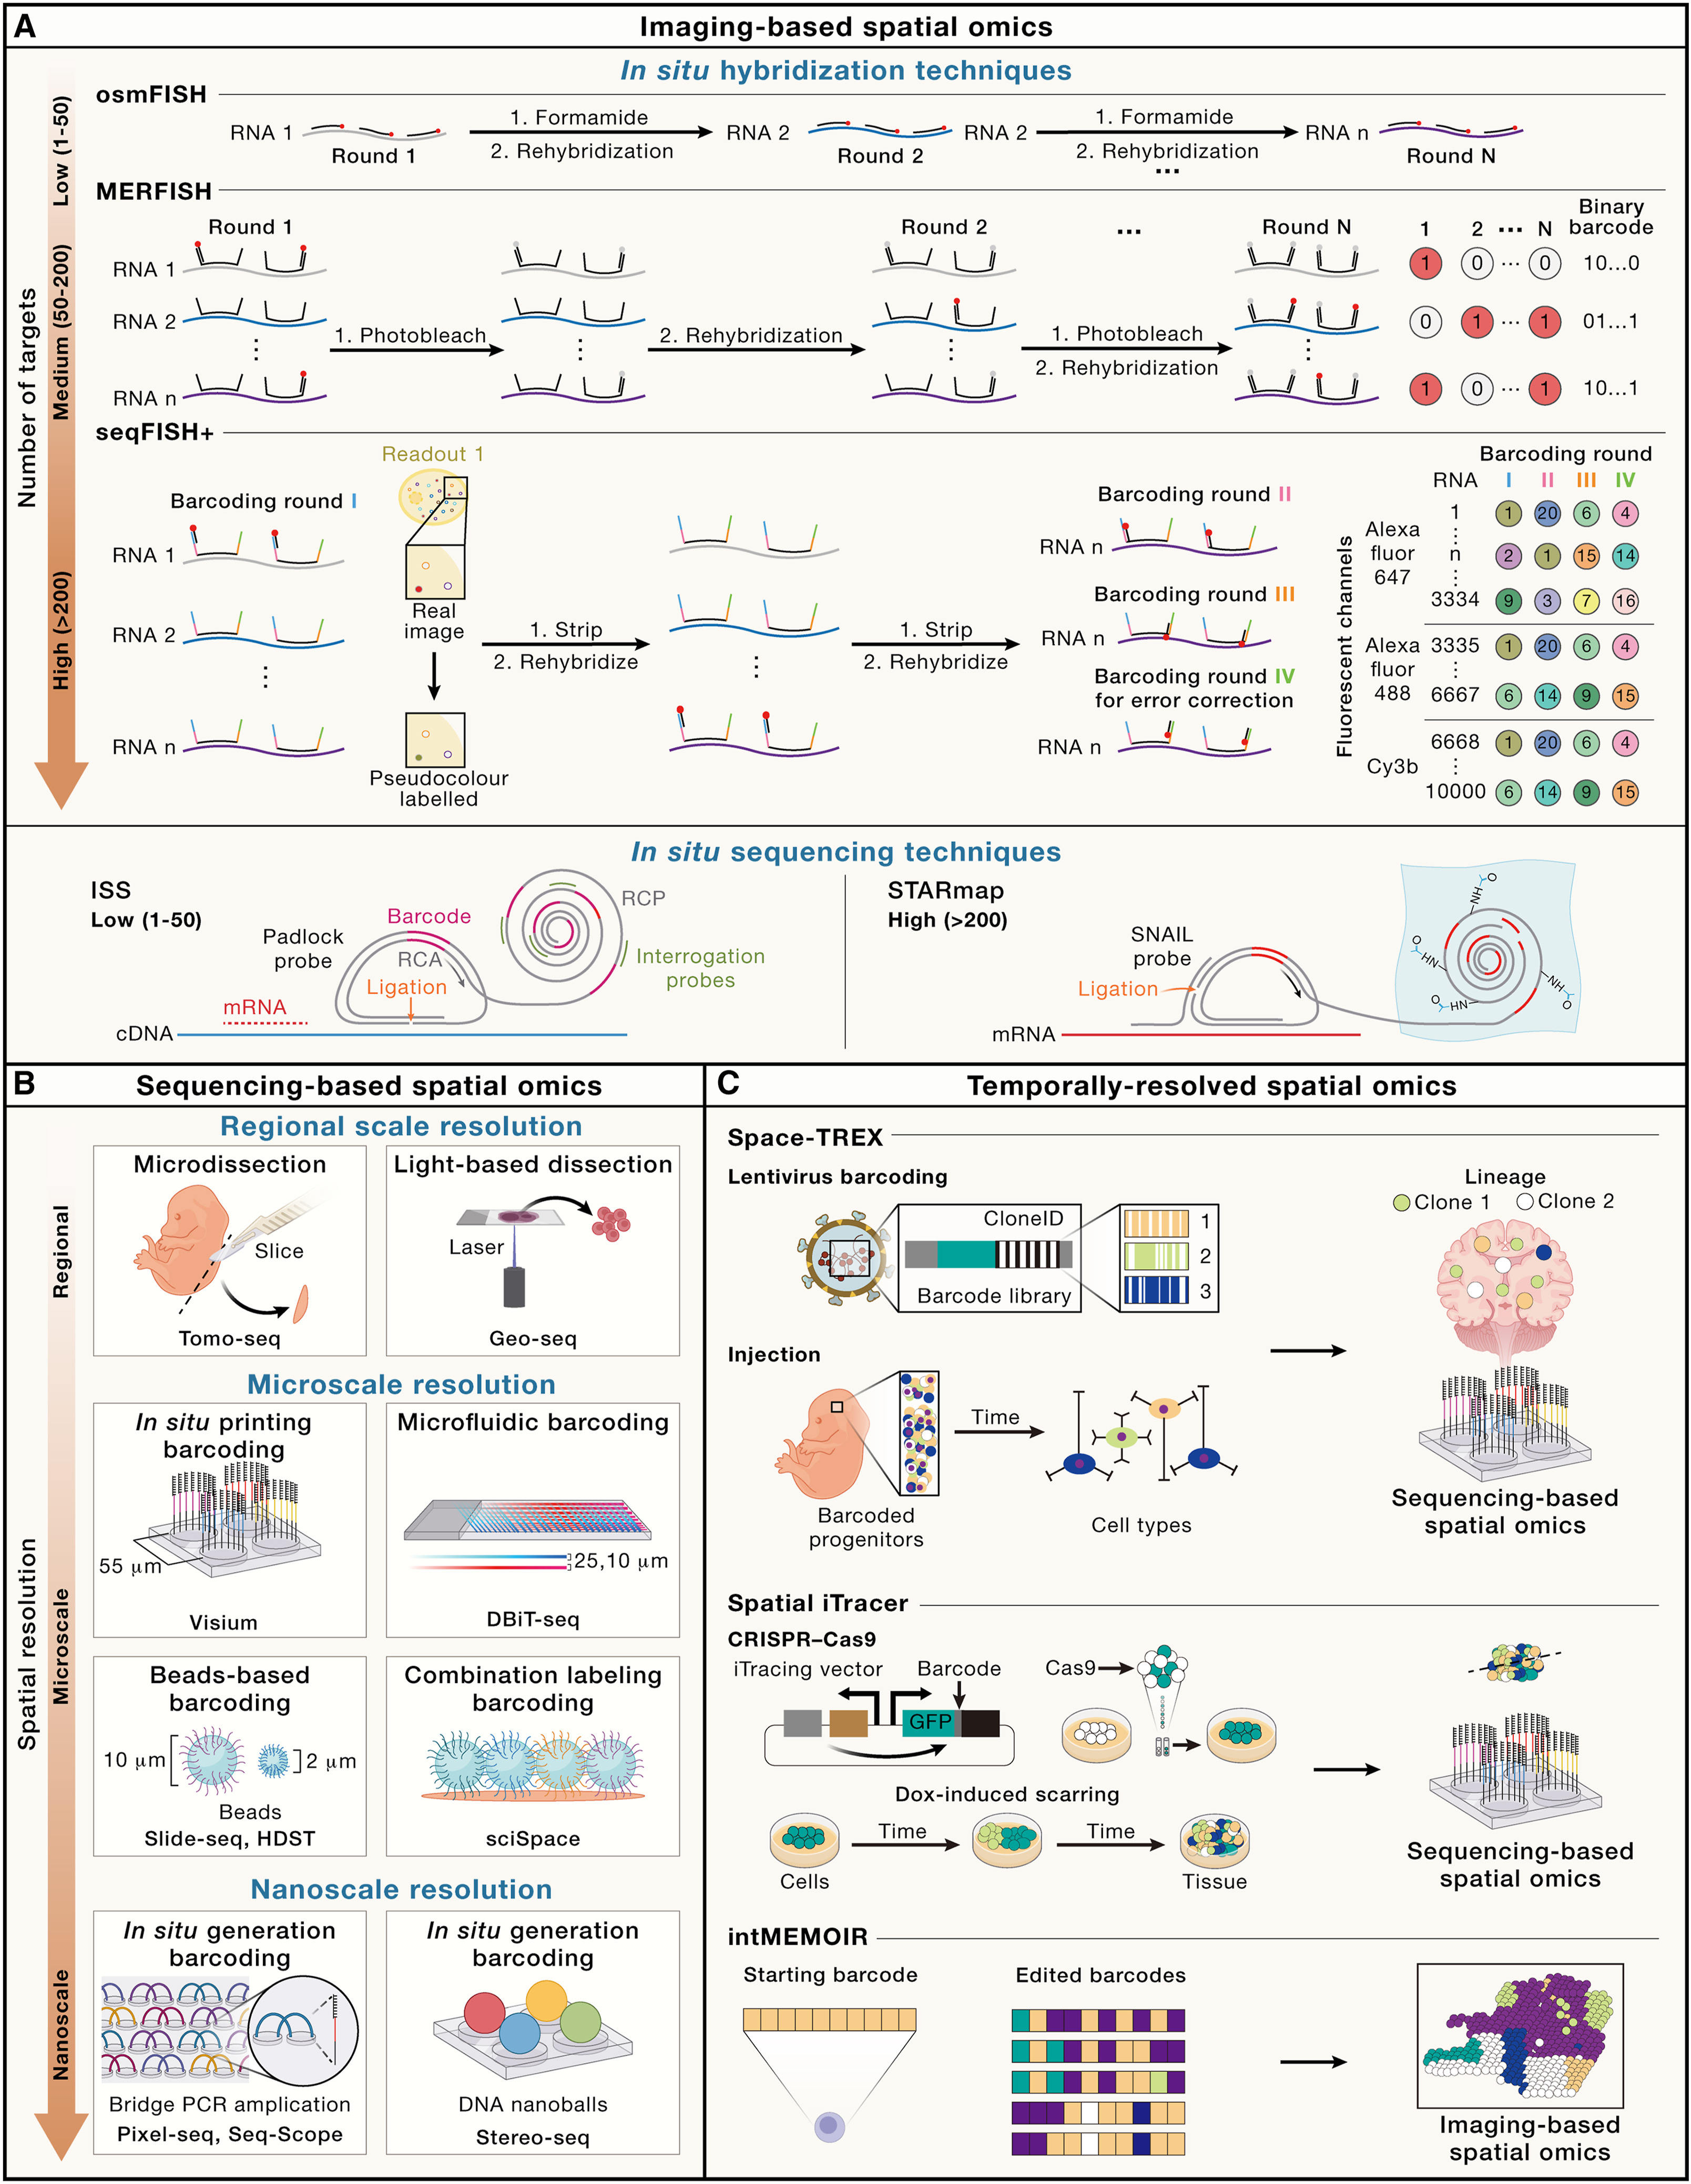
The fundamental essence of spatial omics technology lies in its aptitude for the simultaneous detection of molecular constituents at exact spatial coordinates. Predominant technological advances encompass methodologies reliant on either imaging-based detection or indirect interrogation through massively parallel sequencing. The former, an advanced derivative of single-molecule hybridization techniques, provides a high degree of resolution, transitioning the scope of gene detection from single-gene analysis toward the simultaneous quantification of hundreds to thousands of pre-selected gene targets. In contrast, the latter, inherently capable of unbiased whole-genome analysis, has witnessed a progressive refinement in its precision, advancing from regional to cellular and ultimately to subcellular resolution.
7.6 Spatial transcriptomics Methods
- Video (with good explanation/visualization of the methods)
Spatial transcriptomics: ISH, ISS, ISC
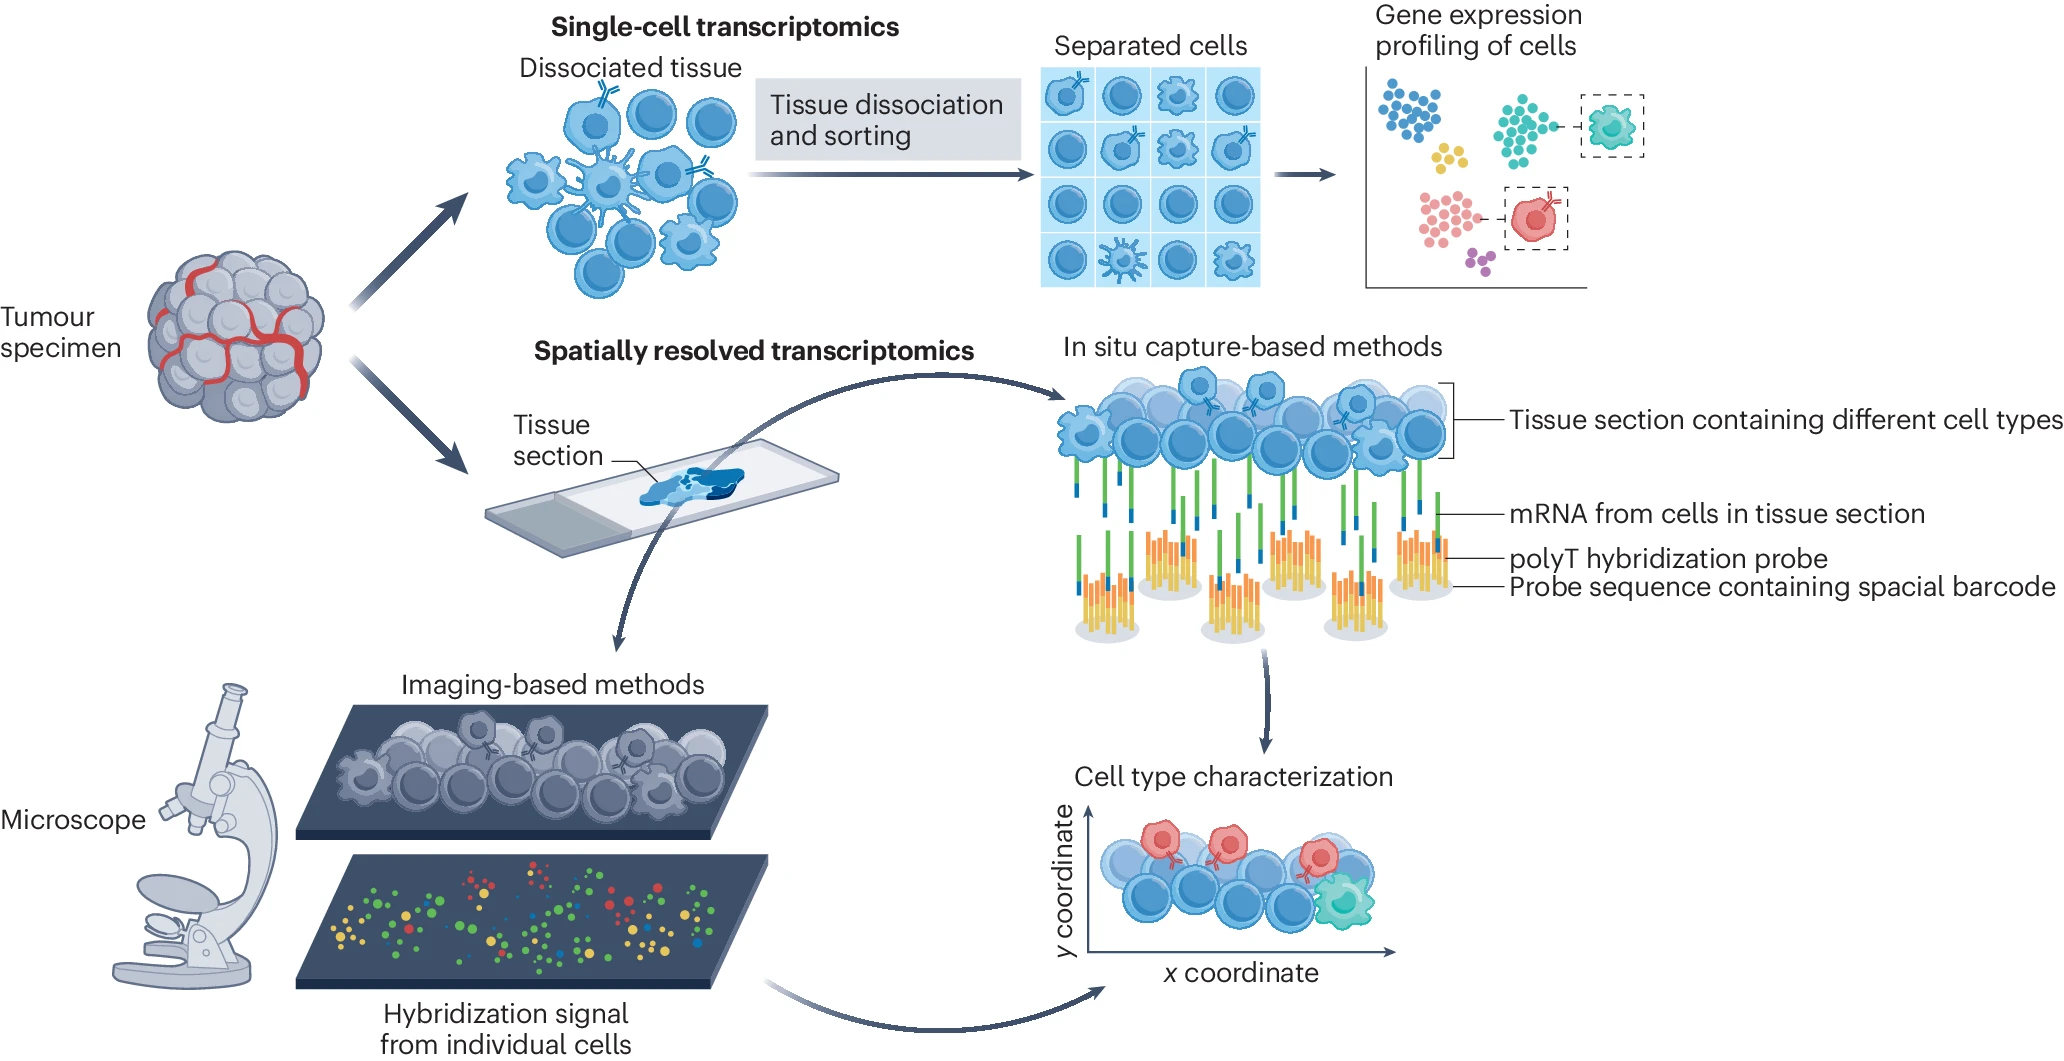
ST encompasses a variety of methods aimed to quantify RNA expression directly from intact tissues.
These methods can be broadly categorized into three main types: in-situ hybridization (ISH), in-situ sequencing (ISS), and in-situ capture (ISC).
ISH techniques includes MERFISH, seqFISH, and seqFISH+.
ISH techniques involve the use of fluorescently labeled probes to detect specific RNA molecules within tissue sections. This method allows for the visualization of gene expression patterns (RNA moleculars) in their native spatial context, providing insights into the localization and abundance of transcripts. (cost and labor++)
ISS techniques, include barcoded padlock probes, fluorescence in-situ sequencing , and SATRmap. enable subcellular resolution and introduce 3D localization of transcripts.
inherently limited by the need ton target known genes and also require specialized equipment. similar to ISH, Kits and equipment are being developed to increase their accessibility and ease of use.(FISSEQ Instrument)
In-situ capturing, ISC techniques, include 10x visium, slide-seq and seq-scope. These technologies capture transcripts in situ and sequecing is then completetd ex situ, which enables unbiased capture of the entire transcriptome using widely avaible next generation sequencing platforms. These techniques currently suffer form lower transcript capture efficiency
ISC methods typically involve the use of barcoded oligonucleotides that capture RNA molecules directly from tissue sections, followed by sequencing to identify the captured transcripts. This approach allows for high-throughput analysis of gene expression across large tissue areas, providing a comprehensive view of the spatial transcriptome. (10x Genomics Visium, Slide-seq, seq-scope) do not reacch single cell resolution yet, but are likely to in the near future.
while each ST technology has its own strengths and limitations, they all share the common goal of providing spatially resolved gene expression data from intact tissues. The choice of method depends on the specific research question, the required resolution, and the available resources. As these technologies continue to evolve, they are expected to become more accessible and widely adopted in various fields of biological research, including cancer biology, neuroscience, and developmental biology.
they can be combined with single cell RNA sequencing (scRNA-seq) to maximize the resolution and depth of data. some of these methods include mapping and deconvolution, which integrate single cell RAN sequencing data with spatial data.
Mapping seeks to assign a cell type resolved by singel cell rna sequencing to its spatial counterpart in ISH or ISS imaging data. Deconvolution seeks to predict the proportion of single cell rna sequencing cell types present within the mixture of transcripts recovered from each capture spot in ISC data. convert multi-cell resolution ISC data to single cell resolution.
- Readinglist
Spatial landscapes of cancers: insights and opportunities
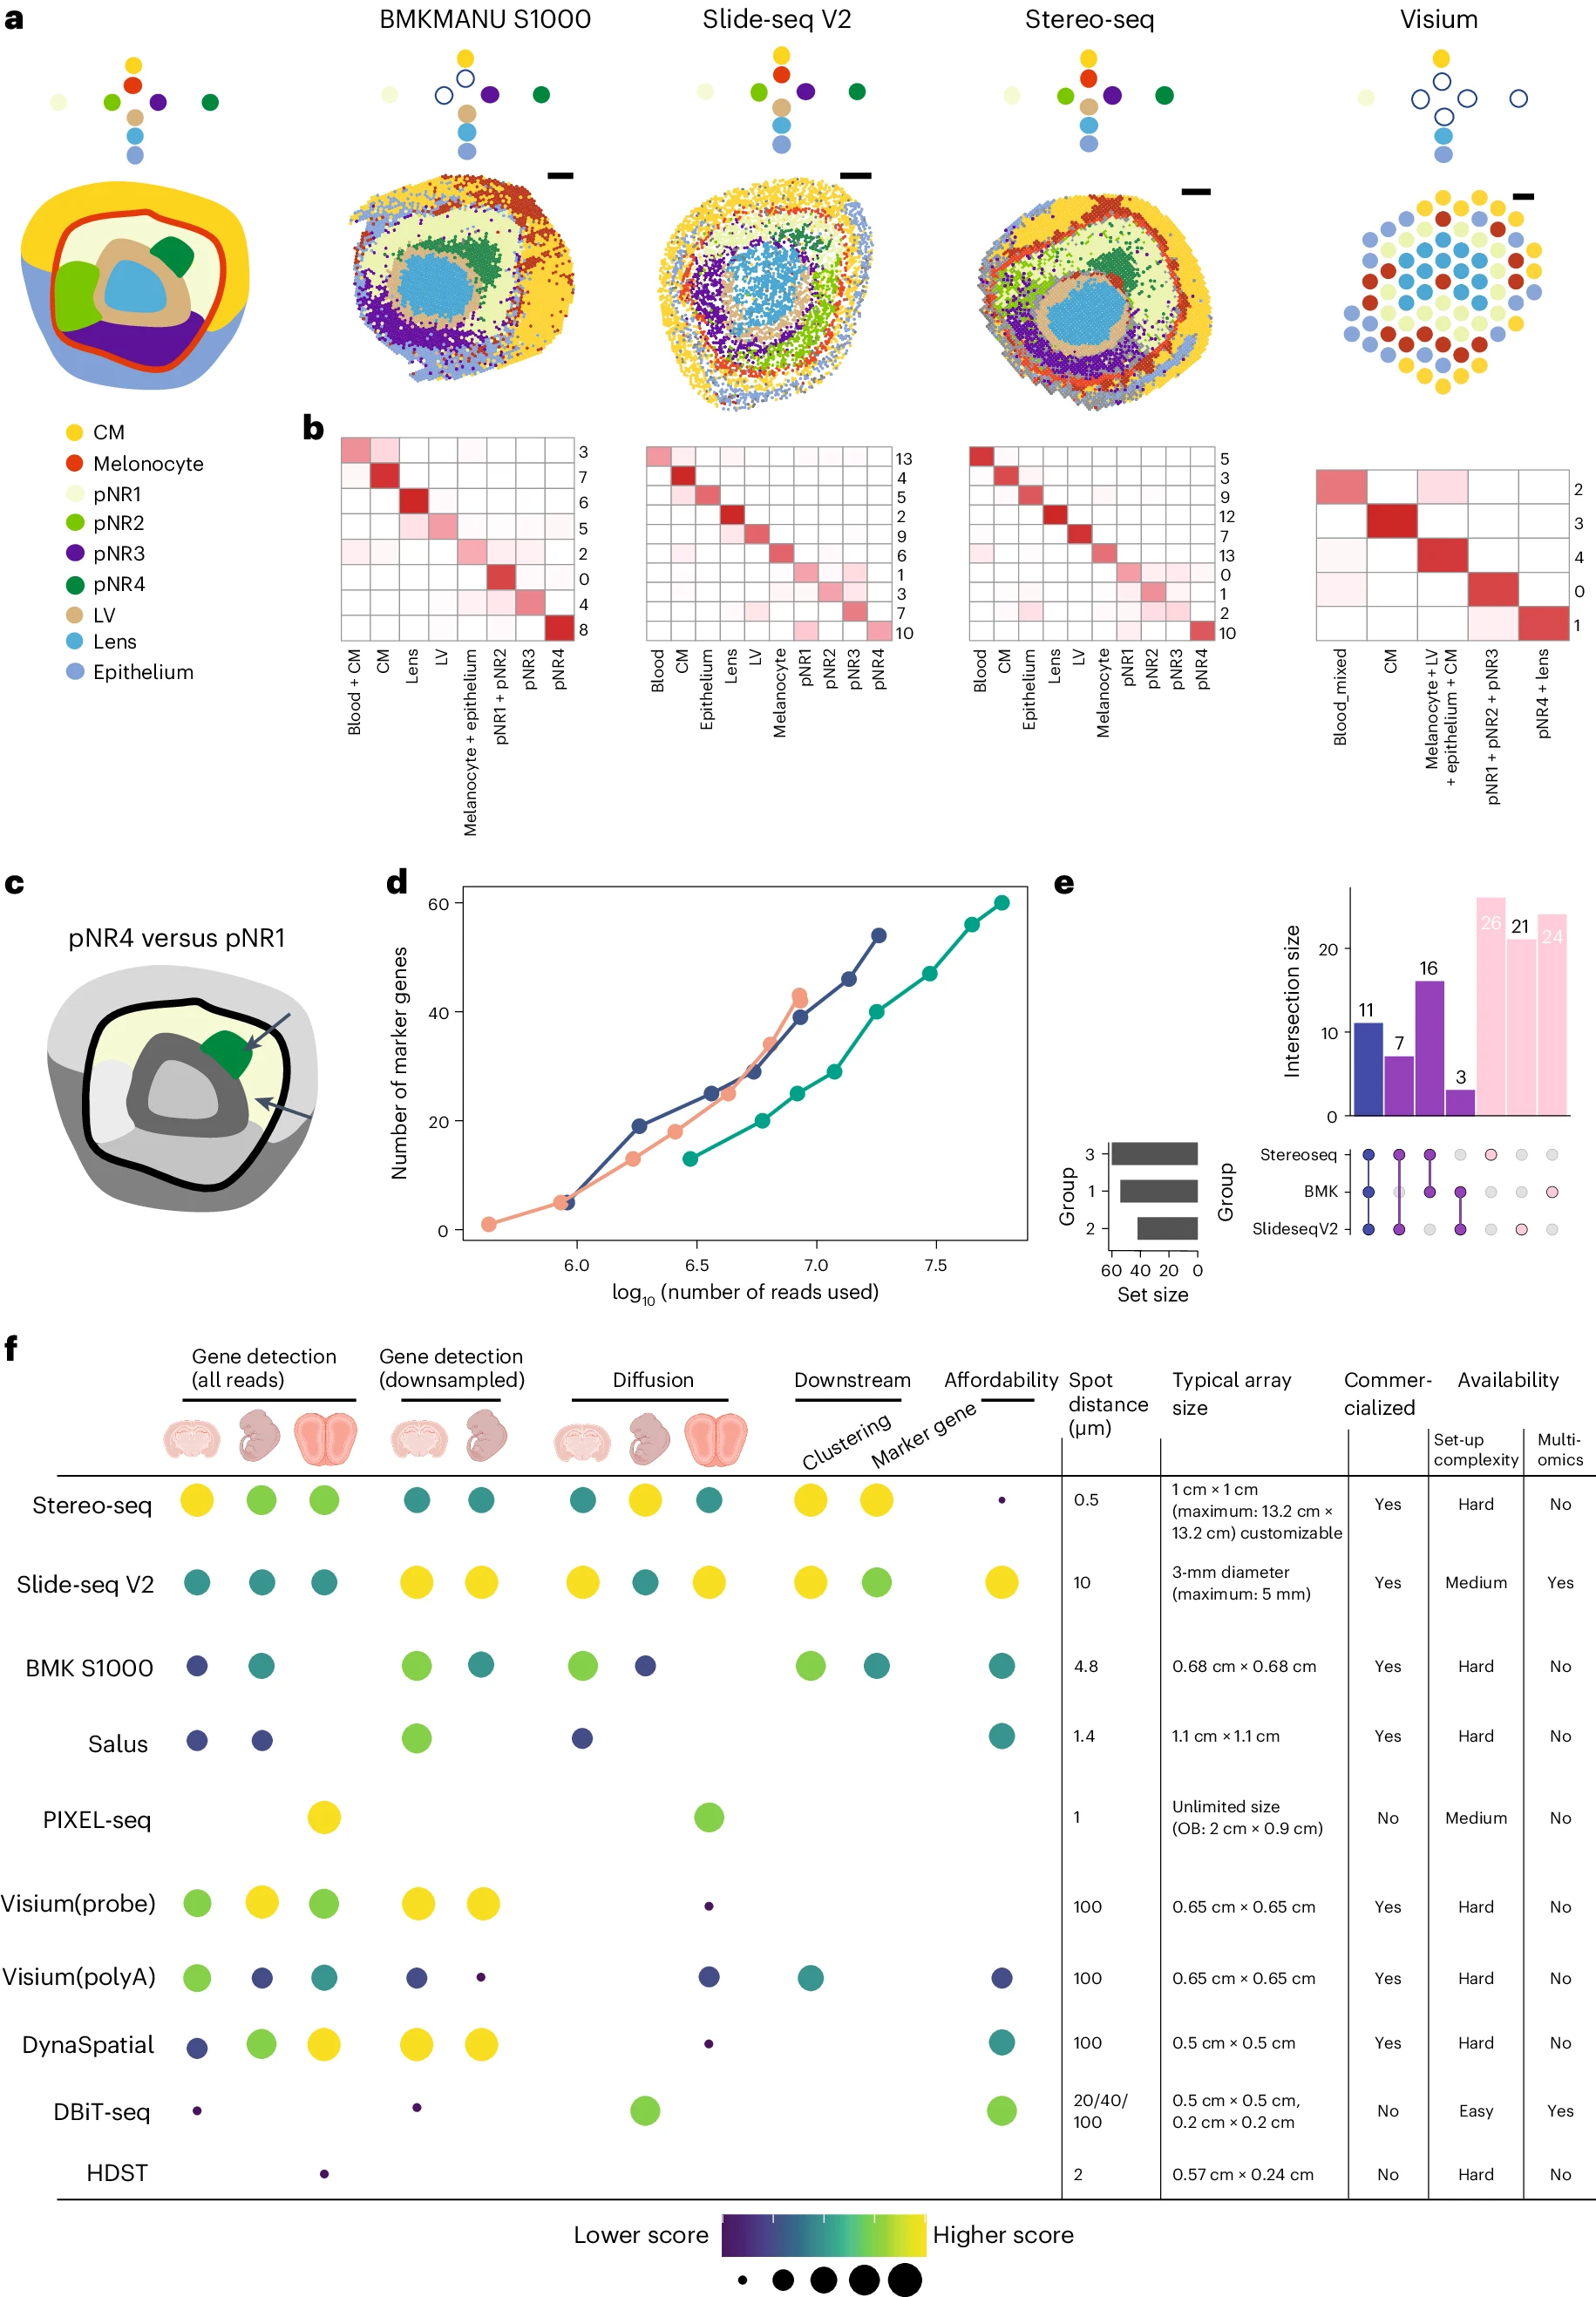
Systematic comparison of sequencing-based spatial transcriptomic methods
7.7 Spatial Datasets Collection
- CNA focused exploration
- DMG+GBM Dataset
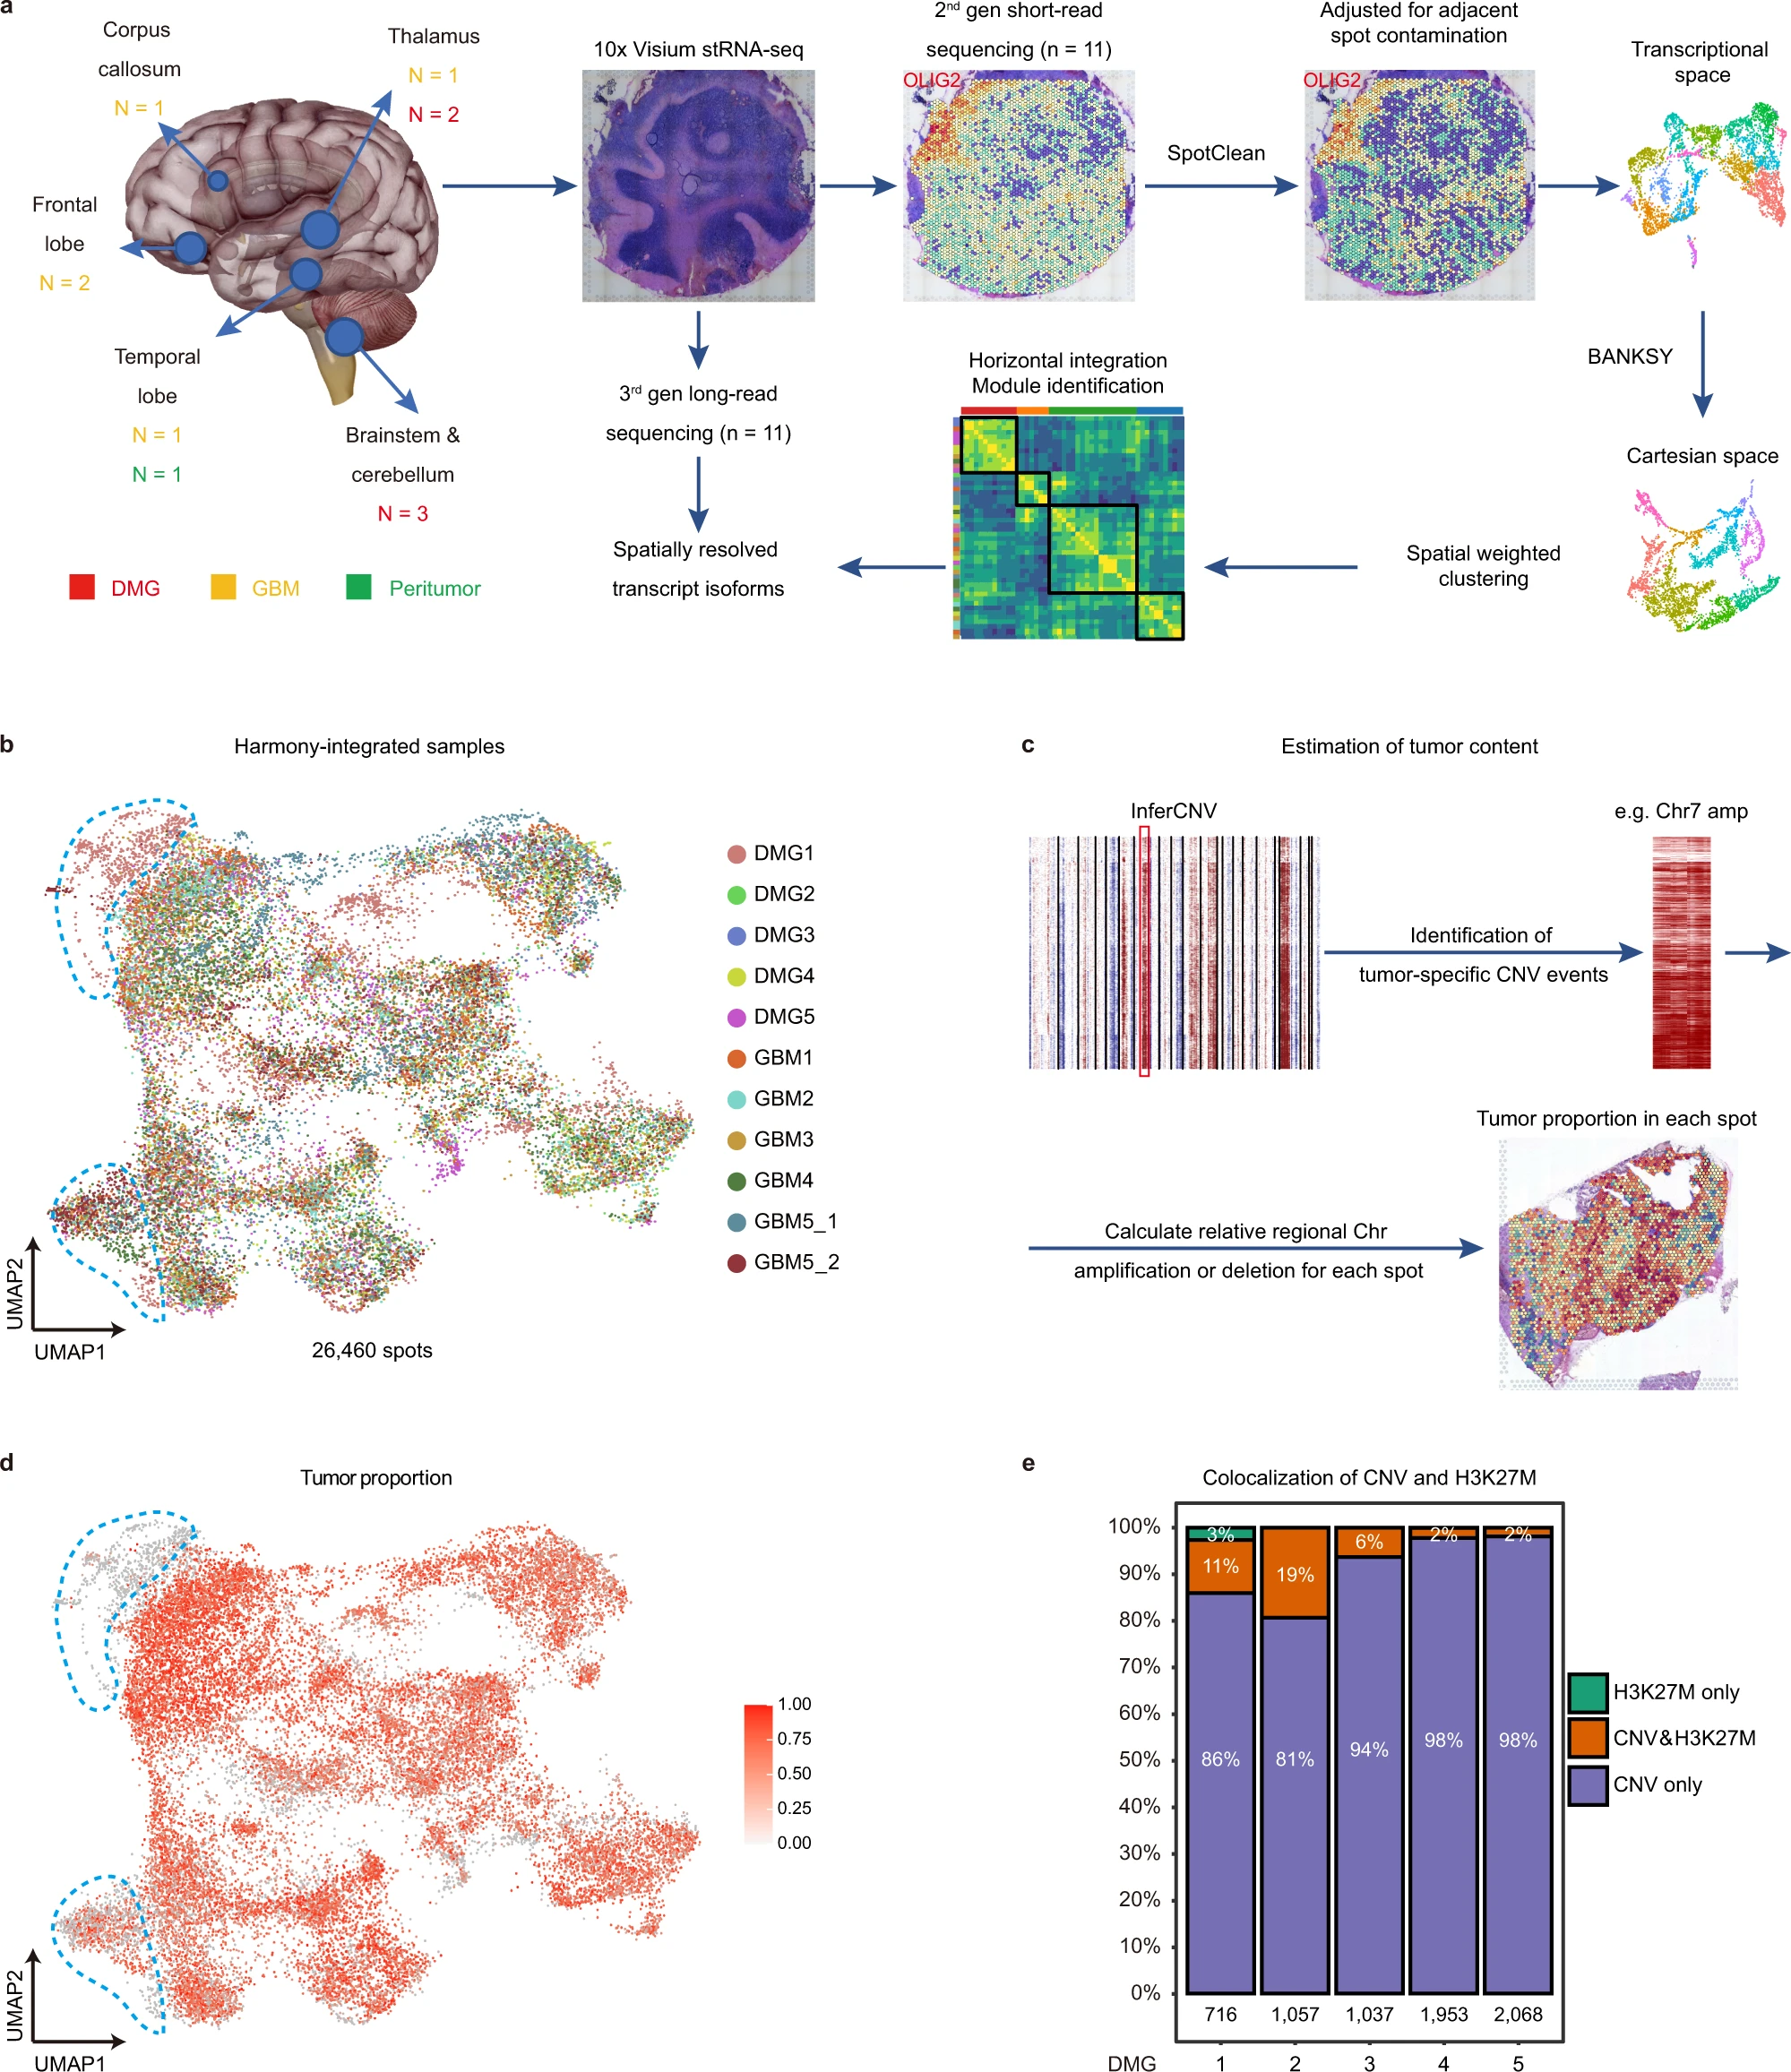
Diffuse midline glioma-H3K27M mutant (DMG) and glioblastoma (GBM) are the most lethal brain tumors that primarily occur in pediatric and adult patients, respectively. Both tumors exhibit significant heterogeneity, shaped by distinct genetic/epigenetic drivers, transcriptional programs including RNA splicing, and microenvironmental cues in glioma niches. However, the spatial organization of cellular states and niche-specific regulatory programs remain to be investigated. Here, we perform a spatial profiling of DMG and GBM combining short- and long-read spatial transcriptomics, and single-cell transcriptomic datasets. We identify clinically relevant transcriptional programs, RNA isoform diversity, and multi-cellular ecosystems across different glioma niches. We find that while the tumor core enriches for oligodendrocyte precursor-like cells, radial glial stem-like (RG-like) cells are enriched in the neuron-rich invasive niche in both DMG and GBM. Further, we identify niche-specific regulatory programs for RG-like cells, and functionally confirm that FAM20C mediates invasive growth of RG-like cells in a neuron-rich microenvironment in a human neural stem cell derived orthotopic DMG model. Together, our results provide a blueprint for understanding the spatial architecture and niche-specific vulnerabilities of DMG and GBM(Ren et al. 2023).
- GBM_ST
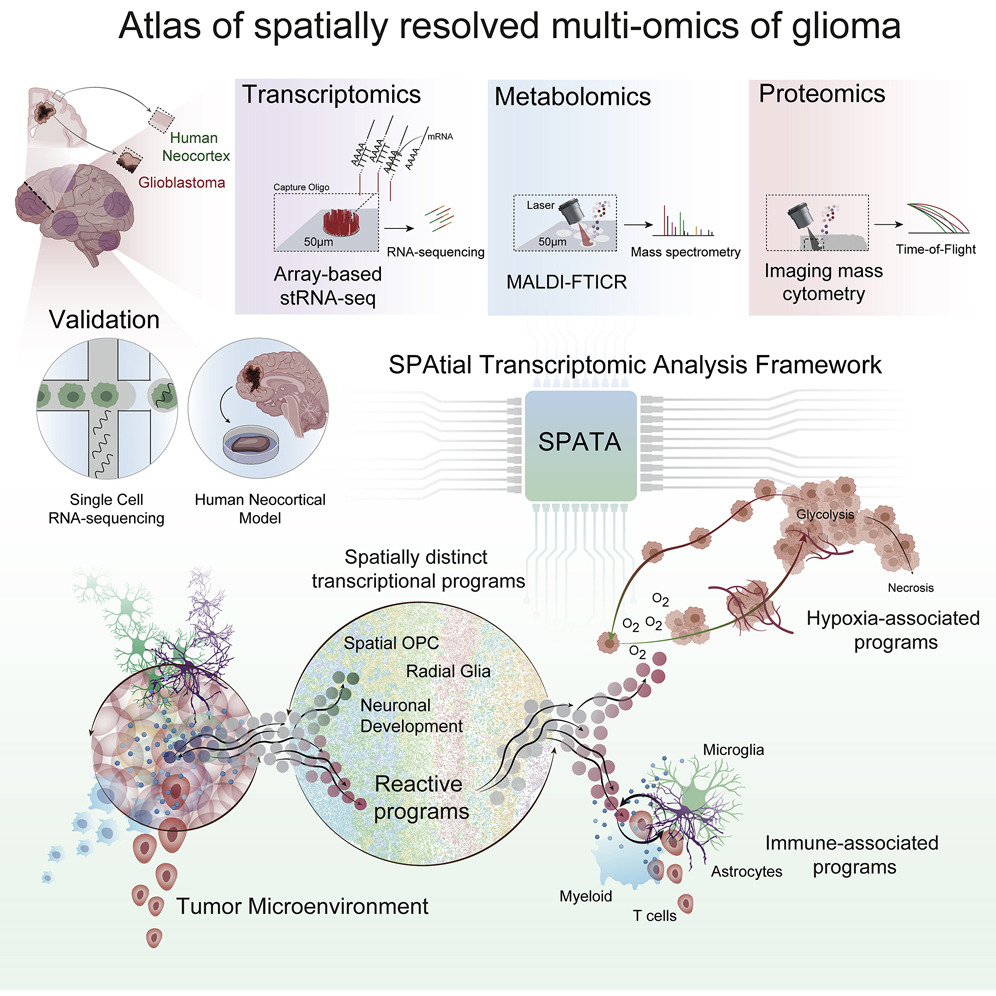
Spatially resolved multi-omics deciphers bidirectional tumor-host interdependence in glioblastoma
Summary Glioblastomas are malignant tumors of the central nervous system hallmarked by subclonal diversity and dynamic adaptation amid developmental hierarchies. The source of dynamic reorganization within the spatial context of these tumors remains elusive. Here, we characterized glioblastomas by spatially resolved transcriptomics, metabolomics, and proteomics. By deciphering regionally shared transcriptional programs across patients, we infer that glioblastoma is organized by spatial segregation of lineage states and adapts to inflammatory and/or metabolic stimuli, reminiscent of the reactive transformation in mature astrocytes. Integration of metabolic imaging and imaging mass cytometry uncovered locoregional tumor-host interdependence, resulting in spatially exclusive adaptive transcriptional programs. Inferring copy-number alterations emphasizes a spatially cohesive organization of subclones associated with reactive transcriptional programs, confirming that environmental stress gives rise to selection pressure. A model of glioblastoma stem cells implanted into human and rodent neocortical tissue mimicking various environments confirmed that transcriptional states originate from dynamic adaptation to various environments(Ravi et al. 2022).
Highlights
Five spatially distinct transcriptional programs are identified in glioblastomas
Hypoxia induces defined transcriptional and genomic responses, including CNAs
Immunosuppressive tumor-myeloid cell interactions are enhanced in segregated niches
Non-stress environments support subtype transition towards developmental stages
- GBM_Multilayer
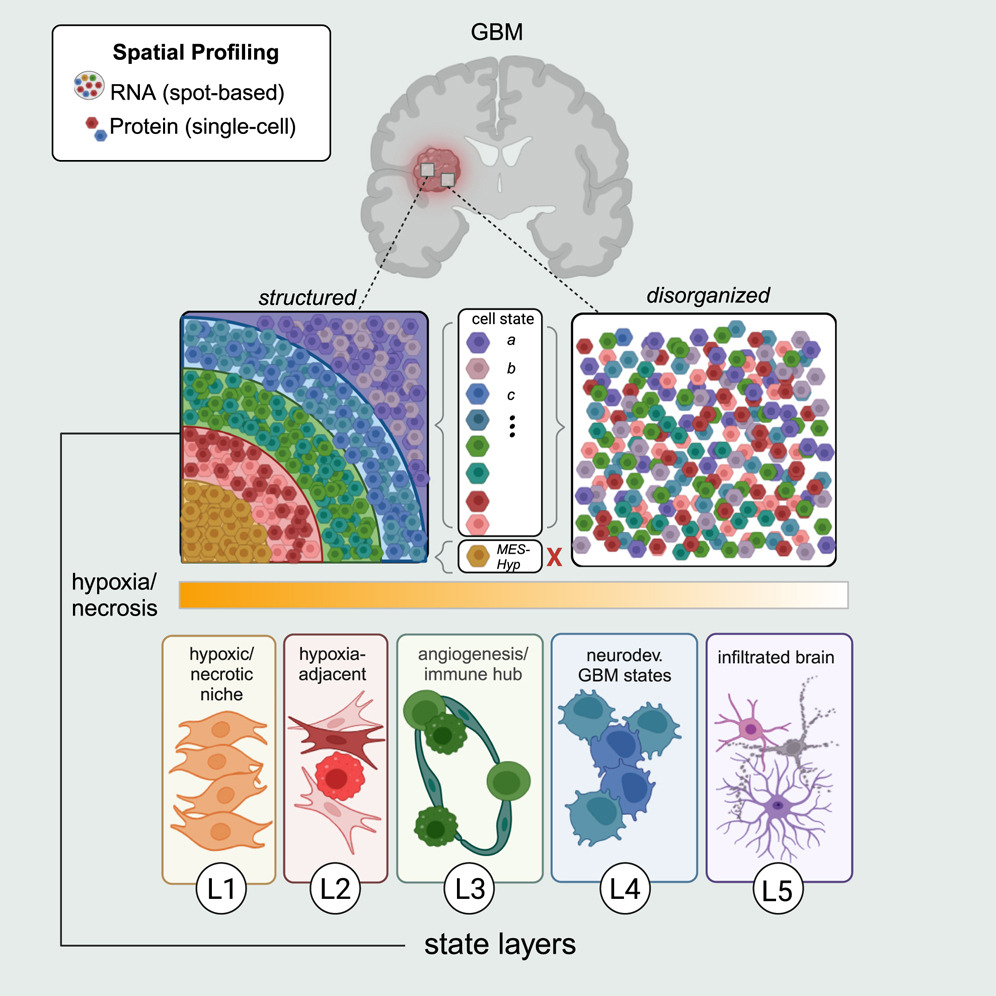
Integrative spatial analysis reveals a multi-layered organization of glioblastoma
Abstract
Glioma contains malignant cells in diverse states. Here, we combine spatial transcriptomics, spatial proteomics, and computational approaches to define glioma cellular states and uncover their organization. We find three prominent modes of organization. First, gliomas are composed of small local environments, each typically enriched with one major cellular state. Second, specific pairs of states preferentially reside in proximity across multiple scales. This pairing of states is consistent across tumors. Third, these pairwise interactions collectively define a global architecture composed of five layers. Hypoxia appears to drive the layers, as it is associated with a long-range organization that includes all cancer cell states. Accordingly, tumor regions distant from any hypoxic/necrotic foci and tumors that lack hypoxia such as low-grade IDH-mutant glioma are less organized. In summary, we provide a conceptual framework for the organization of cellular states in glioma, highlighting hypoxia as a long-range tissue organizer.(Greenwald et al. 2024)
Keywords: glioblastoma; glioma; hypoxia; intratumor heterogeneity; spatial proteomics; spatial transcriptomics.
Experimental model and study participant details
Tumor samples used for Visium spatial transcriptomics and CODEX were obtained from patients undergoing tumor resection at University Hospital Zurich, Zurich, Switzerland (ZH samples), Massachusetts General Hospital, Boston, MA (MGH samples), and Brigham and Women’s Hospital, Boston, MA (BWH samples) carried out in accordance with approved guidelines and with patient written consent under ethics approval KEK-ZH-Nr. 2015-0163, University Hospital Zurich, IRB #10-417, Dana Farber Cancer Institute, and IRB #1360-1, Weizmann Institute of Science. The clinical characteristics of the patient cohort are detailed in Table S1. Tumors ZH1007, ZH1019, ZH881, ZH916, and ZH1041 were spatially annotated by the surgeon during navigated-guided surgery. In these cases, multiple samples were collected from different regions of the same tumor annotated as necrotic, T1 contrast-enhancing, infiltrating, or bulk. Equal numbers of samples from males and females were used in this study (n=17 of each).
Recurrent patterns of expression heterogeneity across gliomas
We identified 14 GBM spatial MPs, including eight malignant and six non-malignant programs, each reflecting a cancer cell state or non-malignant cell type (Figures 2C and 2D; Table S2). Non-malignant MPs included Mac (macrophage/microglia) and Inflammatory-Mac (inflammatory macrophage/neutrophil), Oligo (oligodendrocyte), Vasc (endothelial cells and pericytes), Neuron, and Reactive-Ast (reactive astrocyte). The latter included classical astrocytic markers (e.g., AGT and GJA1) and additional markers suggesting a reactive astrocytic state (e.g., metallothioneins). Of the eight malignant MPs, five directly map to the single-cell GBM states: MES-hypoxia (MES2), MES (MES1), NPC-like, OPC-like, and AC-like (Figures 2D and S2G). As expected, the neurodevelopmental-related malignant MPs (NPC-like, OPC-like, and AC-like) had high gene overlap with signatures of the respective non-malignant cell-type signatures, as also seen for the respective MPs derived from scRNA-seq (Figure S2H). The three additional malignant spatial MPs include: (1) an astrocytic-like mesenchymal MP (MES-Ast) with enrichment of genes associated with glioma tumor microtubes (e.g., GAP43, KCNF1, and PTN) (Figure S2I);24,25,26 (2) proliferation and metabolism (Prolif-Metab), enriched with proliferation-related (e.g., CTNNB1, CNTD1, and TP53) and metabolism (e.g., SLC16A1 [MCT1], GGCX, and PHGK1) genes; and (3) chromatin regulation (Chromatin-Reg), enriched with chromatin and transcriptional regulators (e.g., ATRX, KMT2E, BRD4, and SOX4), as well as with NPC-related genes (Figure S2J). Re-analysis of GBM scRNA-seq data supports these MPs as representing rare cellular states with partial similarity to previously defined states (Figures S2K, S2L, and S3A) and further shows that MES-Ast represents a unique state and not the simple combination of colocalized MES-like and AC-like cancer cells (Figure S3B).
- Liver
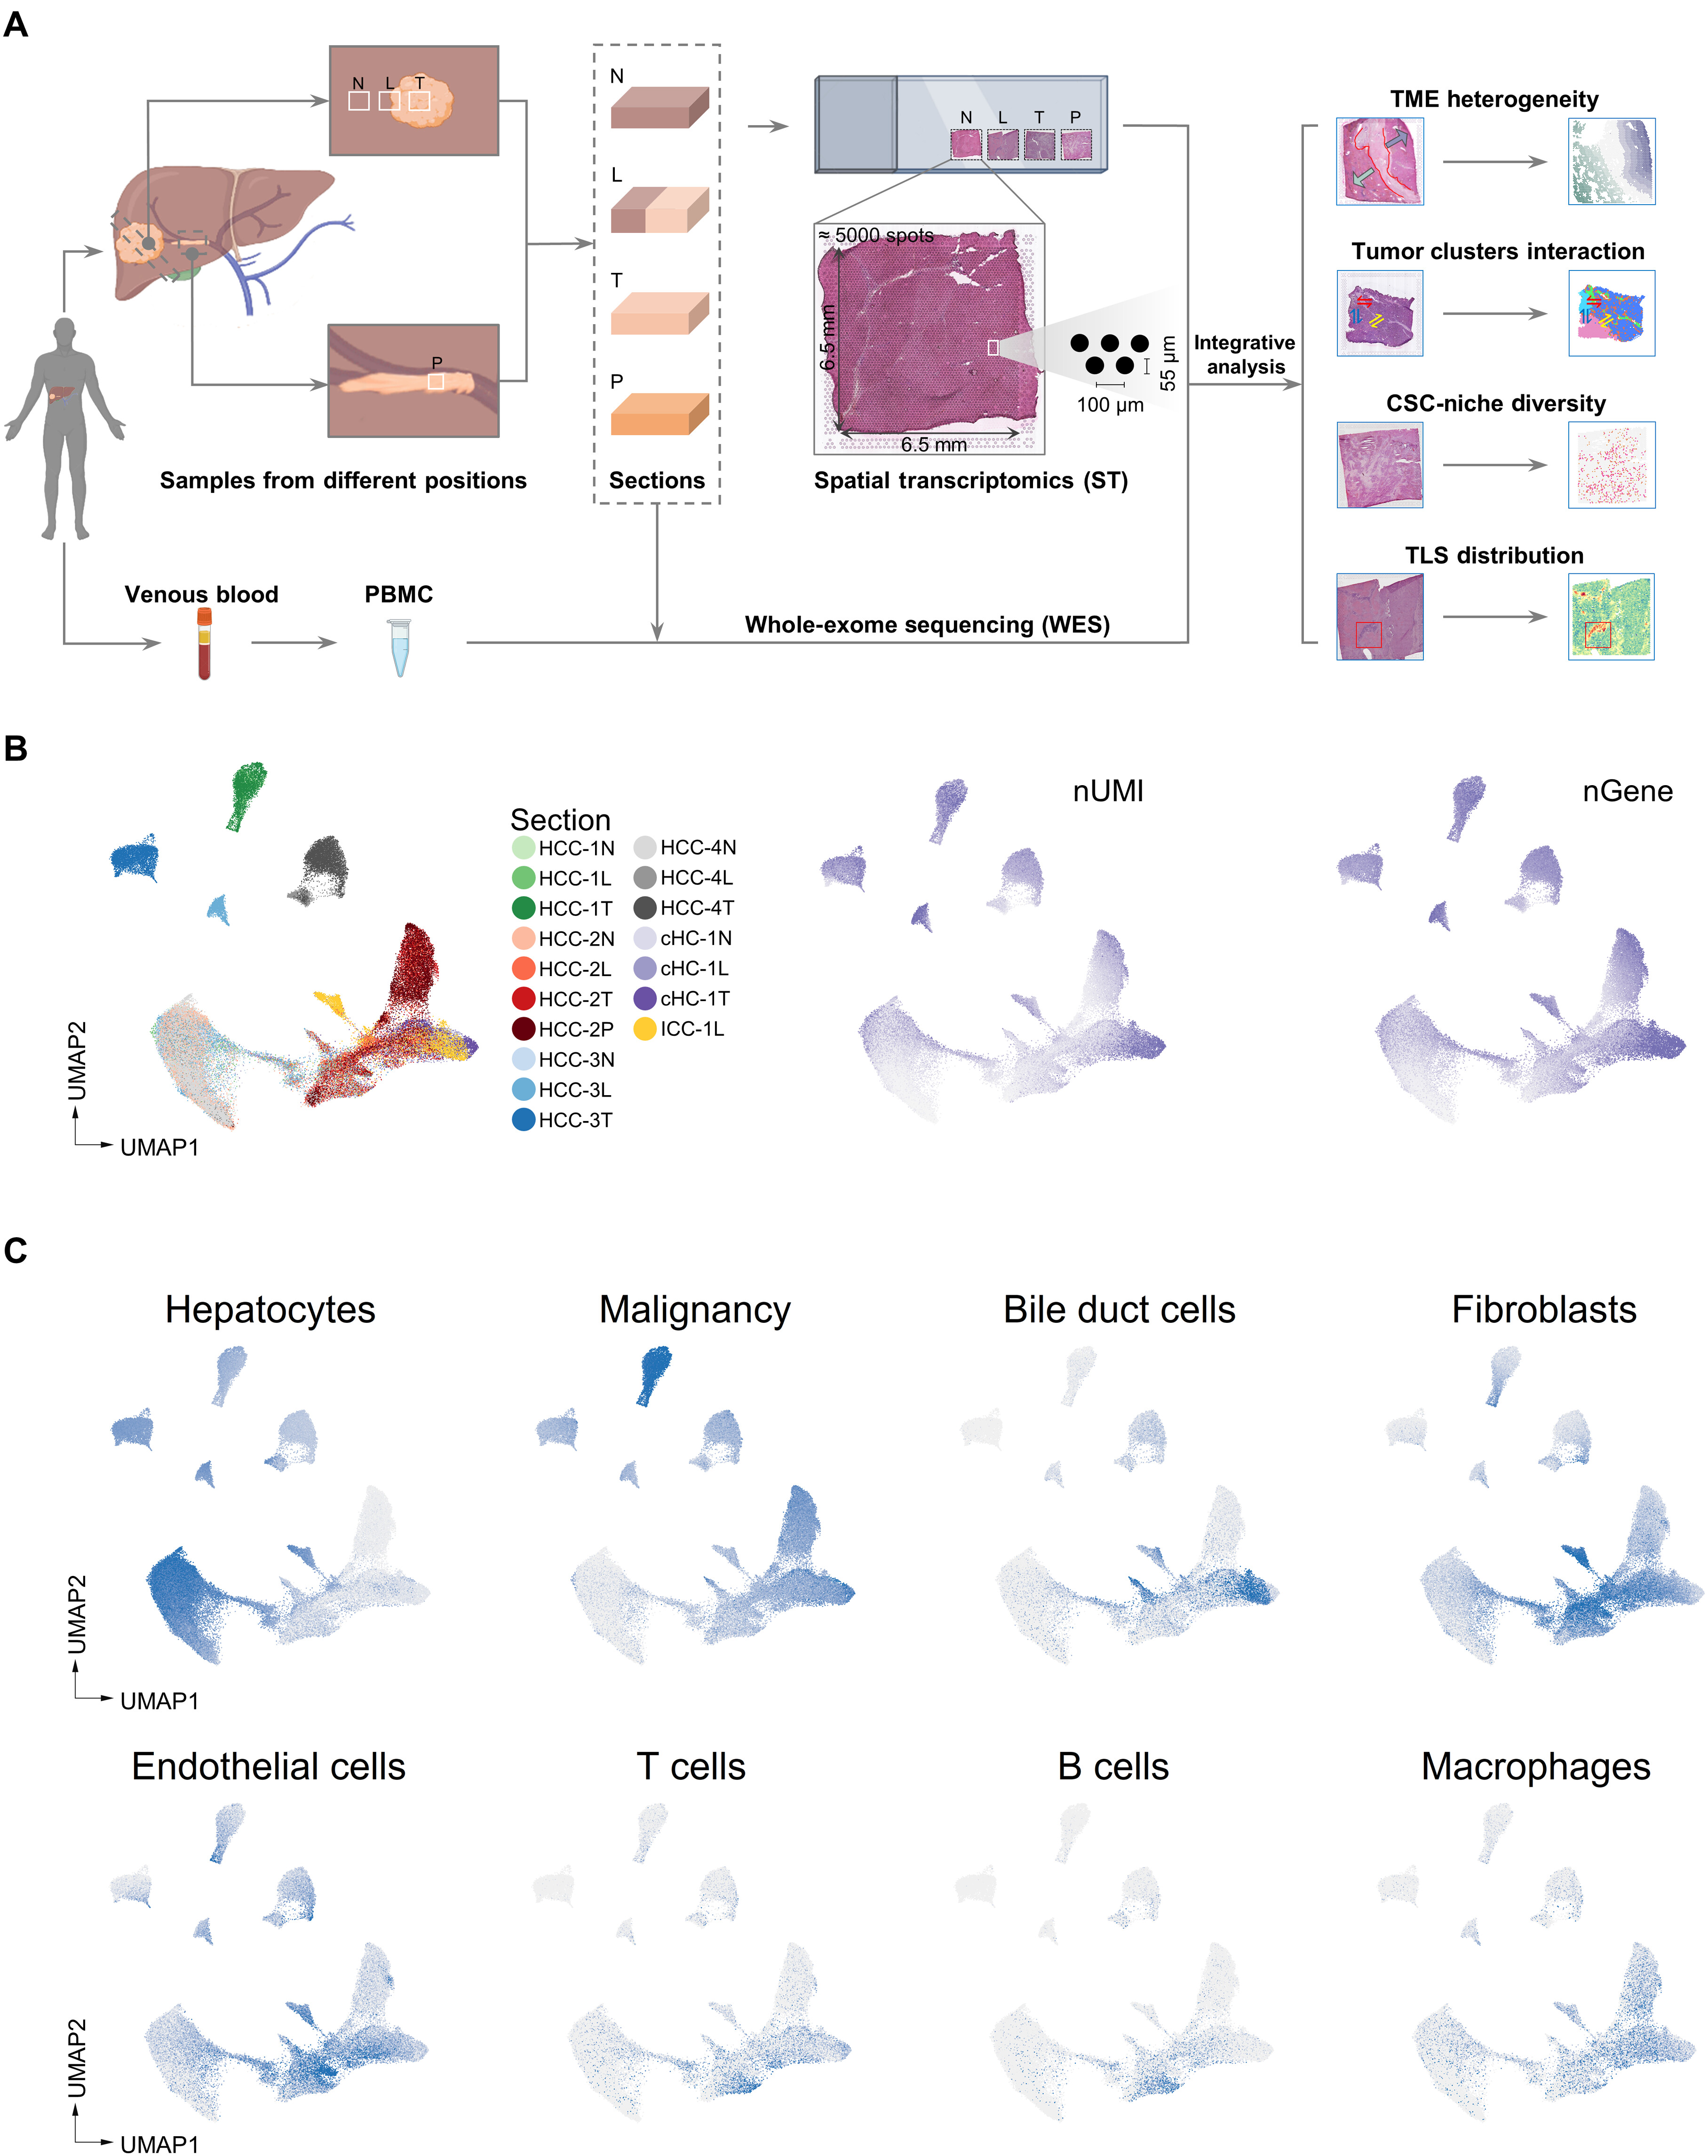
Comprehensive analysis of spatial architecture in primary liver cancer
Heterogeneity is the major challenge for cancer prevention and therapy. Here, we first constructed high-resolution spatial transcriptomes of primary liver cancers (PLCs) containing 84,823 spots within 21 tissues from seven patients. The progressive comparison of spatial tumor microenvironment (TME) characteristics from nontumor to leading-edge to tumor regions revealed that the tumor capsule potentially affects intratumor spatial cluster continuity, transcriptome diversity, and immune cell infiltration. Locally, we found that the bidirectional ligand-receptor interactions at the 100-μm-wide cluster-cluster boundary contribute to maintaining intratumor architecture and the PROM1+ and CD47+ cancer stem cell niches are related to TME remodeling and tumor metastasis. Last, we proposed a TLS-50 signature to accurately locate tertiary lymphoid structures (TLSs) spatially and unveiled that the distinct composition of TLSs is shaped by their distance to tumor cells. Our study provides previous unknown insights into the diverse tumor ecosystem of PLCs and has potential benefits for cancer intervention.(Wu et al. 2021)
- NPC
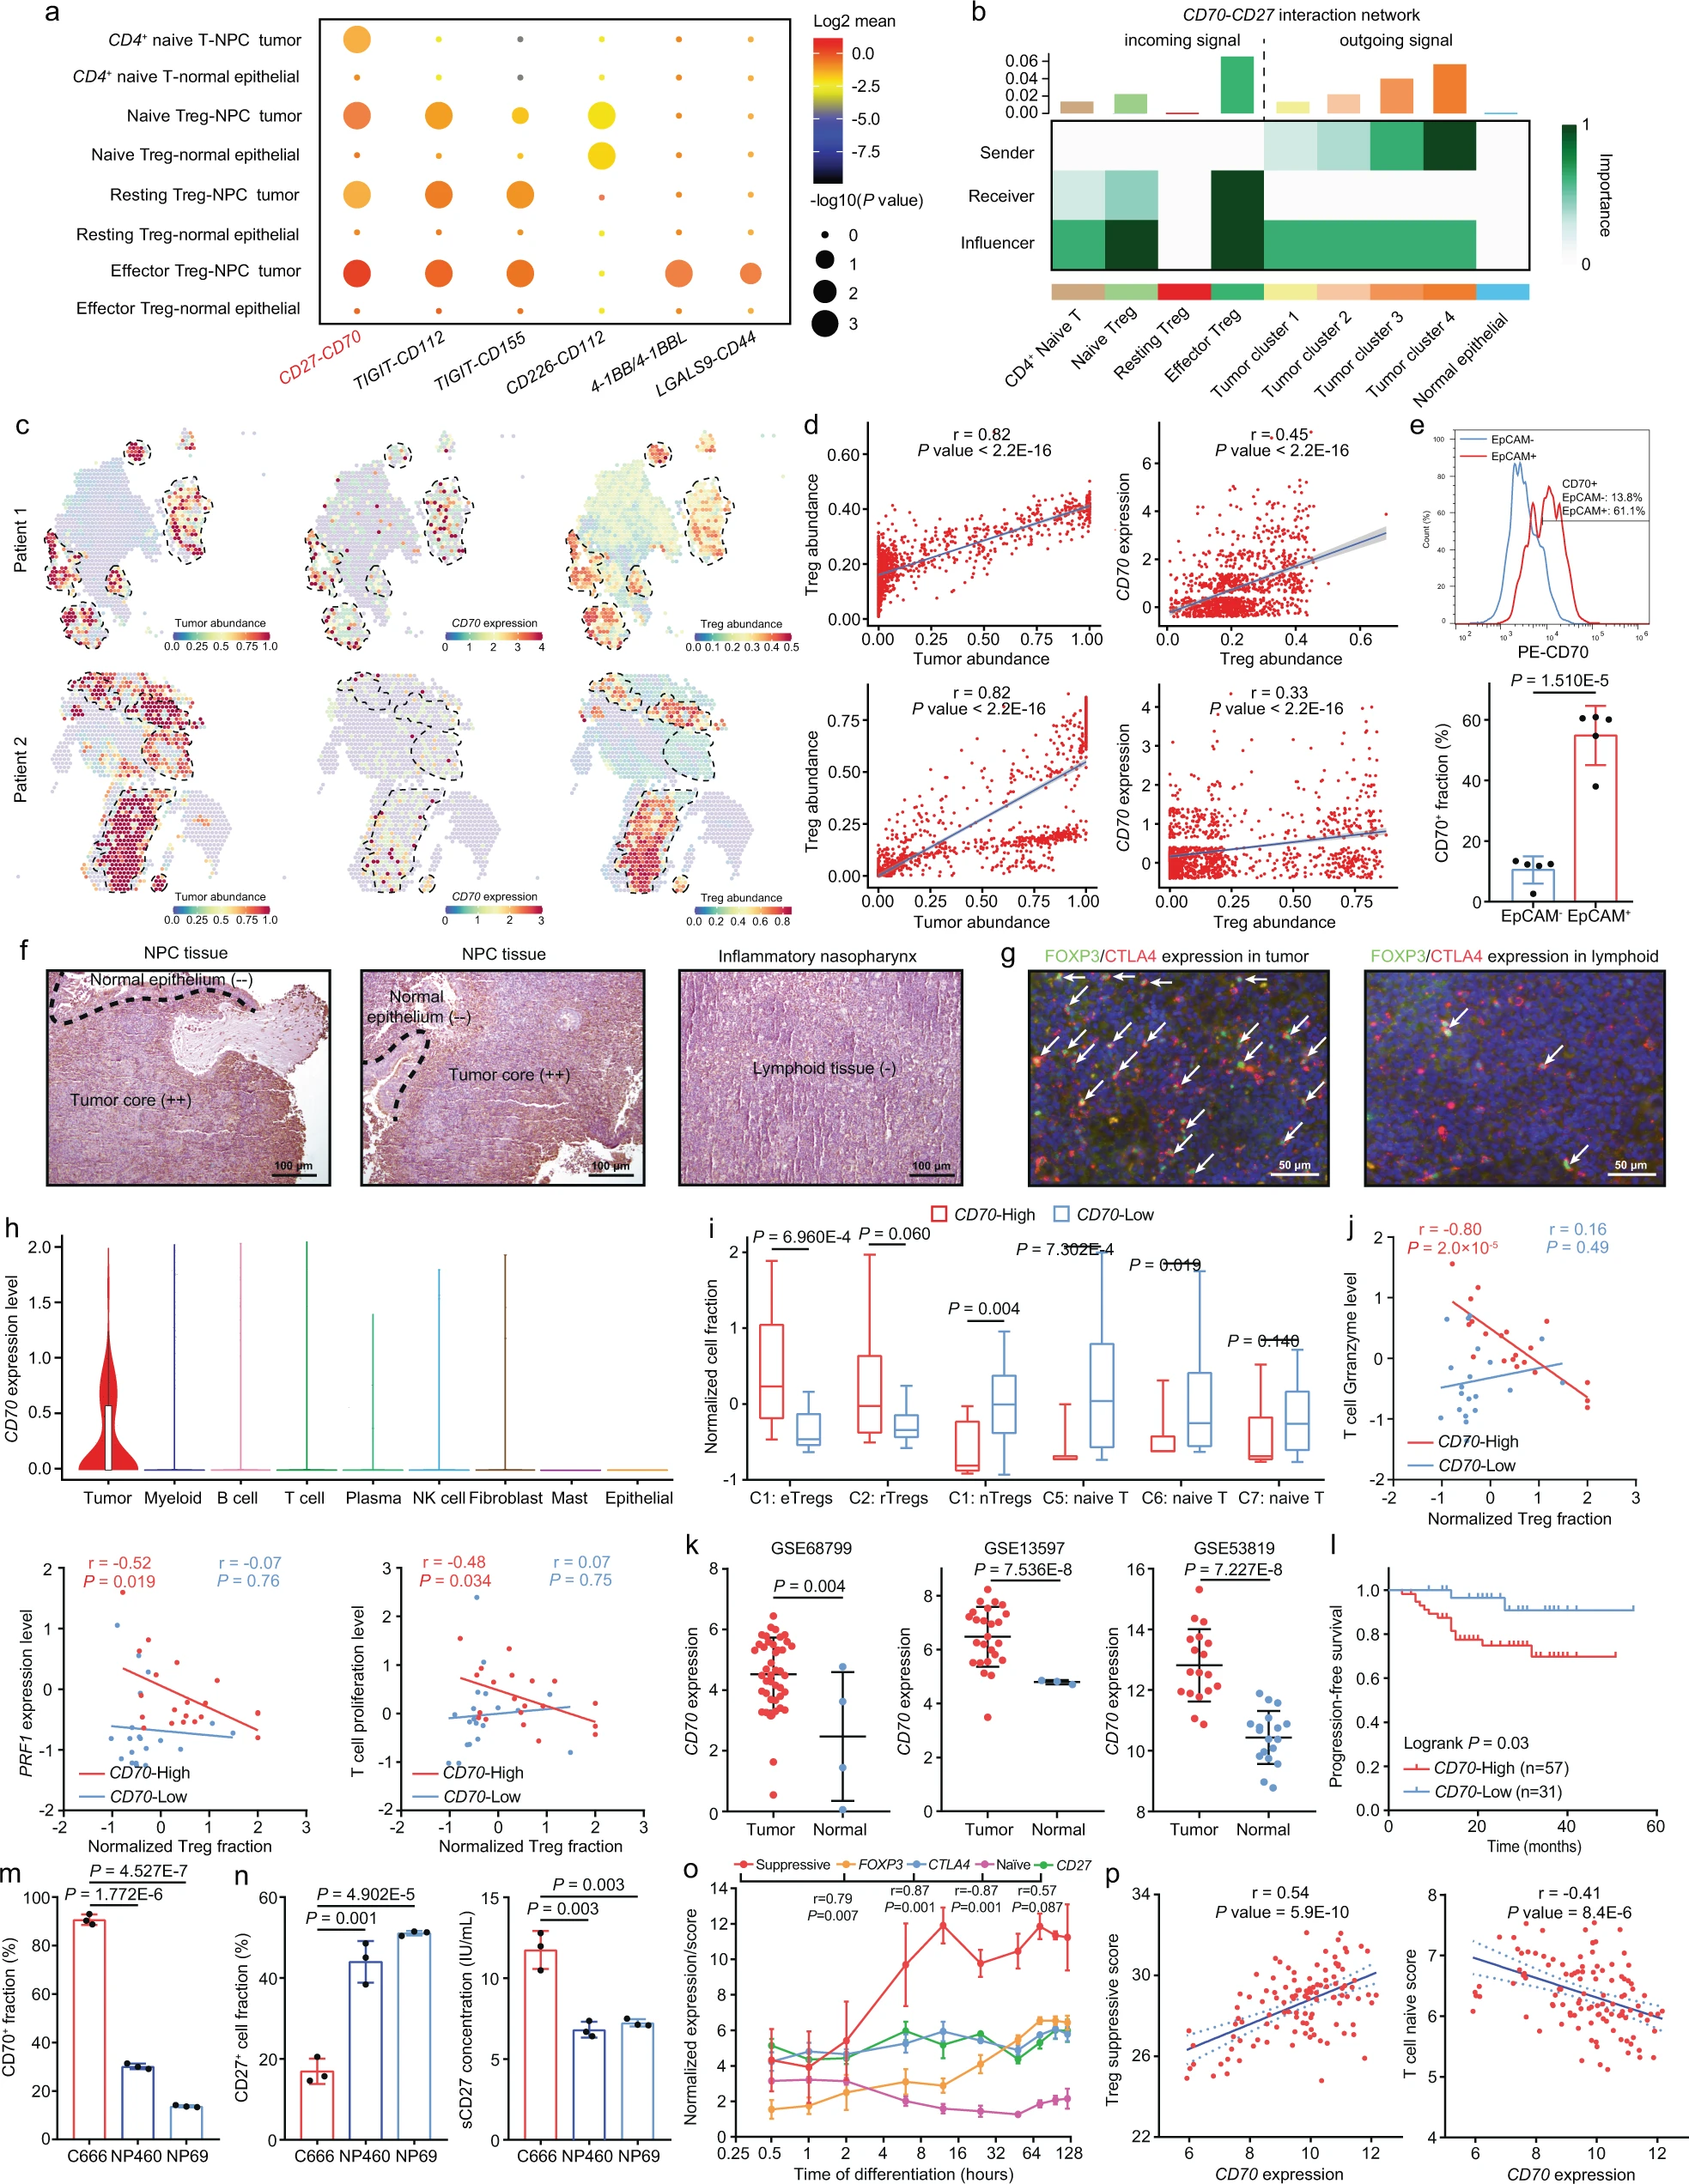
Abstract Despite the intense CD8+ T-cell infiltration in the tumor microenvironment of nasopharyngeal carcinoma, anti-PD-1 immunotherapy shows an unsatisfactory response rate in clinical trials, hindered by immunosuppressive signals. To understand how microenvironmental characteristics alter immune homeostasis and limit immunotherapy efficacy in nasopharyngeal carcinoma, here we establish a multi-center single-cell cohort based on public data, containing 357,206 cells from 50 patient samples. We reveal that nasopharyngeal carcinoma cells enhance development and suppressive activity of regulatory T cells via CD70-CD27 interaction. CD70 blocking reverts Treg-mediated suppression and thus reinvigorate CD8+ T-cell immunity. Anti-CD70+ anti-PD-1 therapy is evaluated in xenograft-derived organoids and humanized mice, exhibiting an improved tumor-killing efficacy. Mechanistically, CD70 knockout inhibits a collective lipid signaling network in CD4+ naive and regulatory T cells involving mitochondrial integrity, cholesterol homeostasis, and fatty acid metabolism. Furthermore, ATAC-Seq delineates that CD70 is transcriptionally upregulated by NFKB2 via an Epstein-Barr virus-dependent epigenetic modification. Our findings identify CD70+ nasopharyngeal carcinoma cells as a metabolic switch that enforces the lipid-driven development, functional specialization and homeostasis of Tregs, leading to immune evasion. This study also demonstrates that CD70 blockade can act synergistically with anti-PD-1 treatment to reinvigorate T-cell immunity against nasopharyngeal carcinoma (Gong et al. 2023).
- Prostate
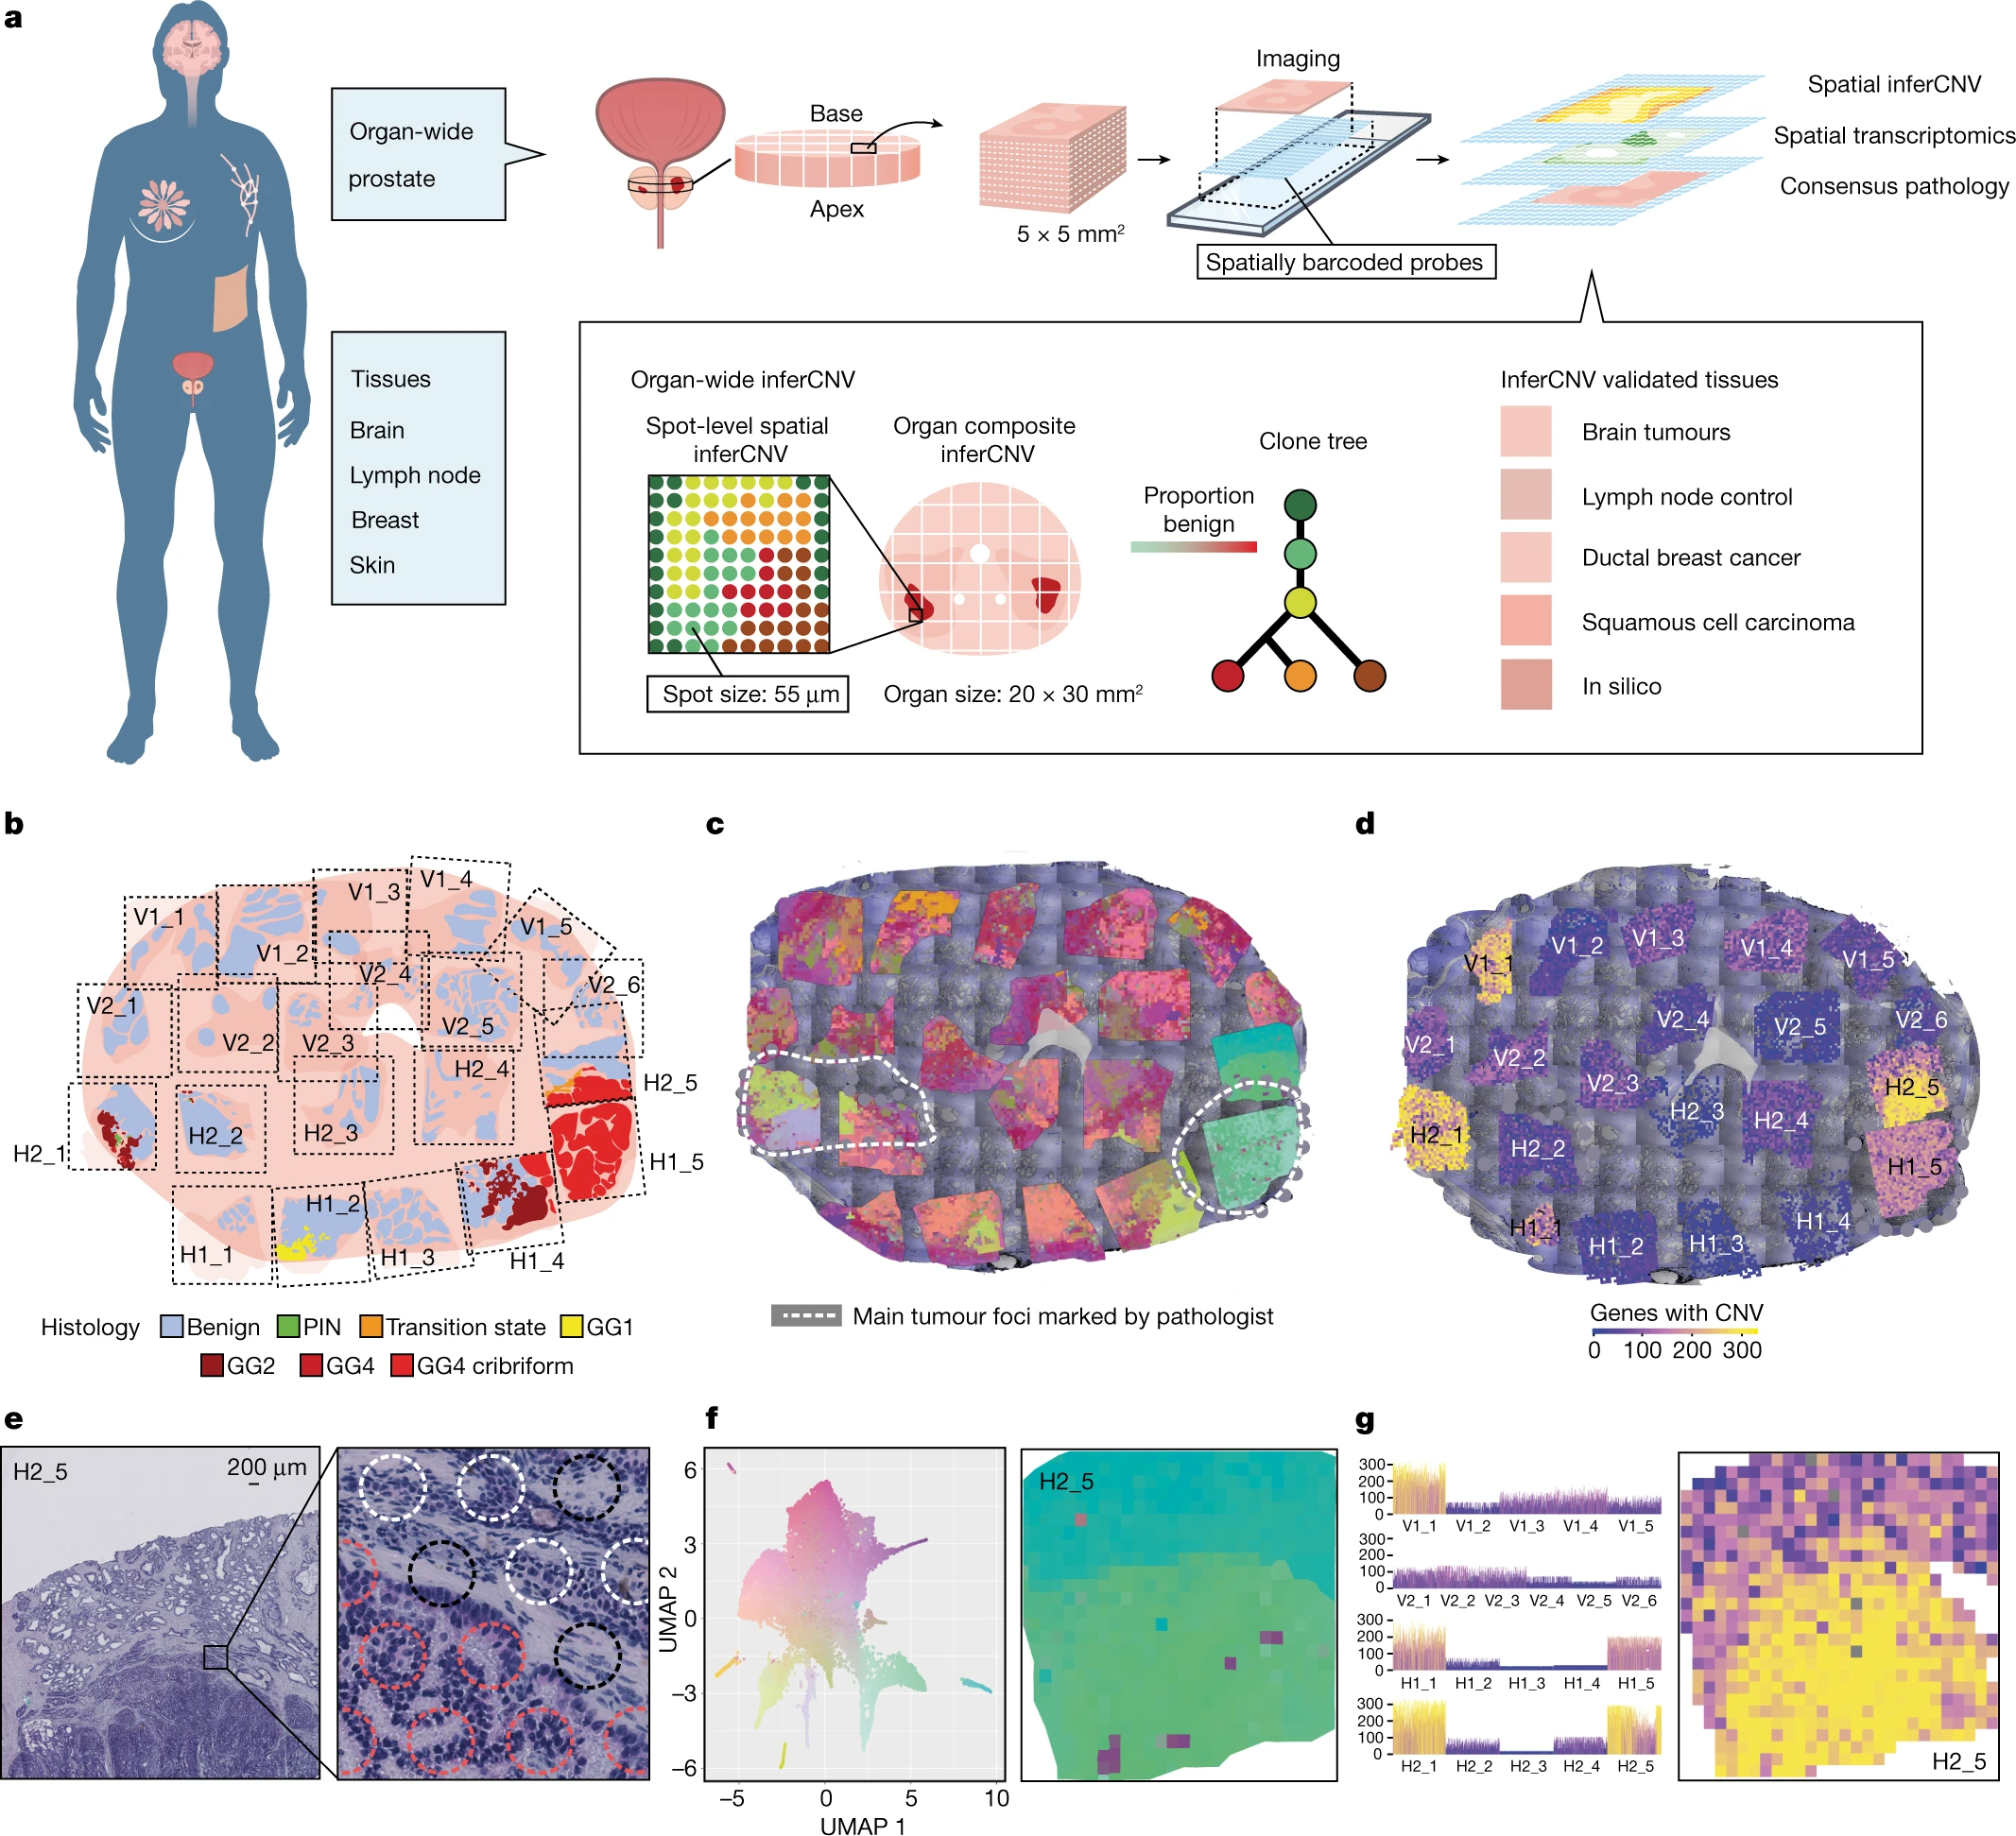
Spatially resolved clonal copy number alterations in benign and malignant tissue
Defining the transition from benign to malignant tissue is fundamental to improving early diagnosis of cancer1. Here we use a systematic approach to study spatial genome integrity in situ and describe previously unidentified clonal relationships. We used spatially resolved transcriptomics2 to infer spatial copy number variations in >120,000 regions across multiple organs, in benign and malignant tissues. We demonstrate that genome-wide copy number variation reveals distinct clonal patterns within tumours and in nearby benign tissue using an organ-wide approach focused on the prostate. Our results suggest a model for how genomic instability arises in histologically benign tissue that may represent early events in cancer evolution. We highlight the power of capturing the molecular and spatial continuums in a tissue context and challenge the rationale for treatment paradigms, including focal therapy.(Erickson et al. 2022)
- Skin
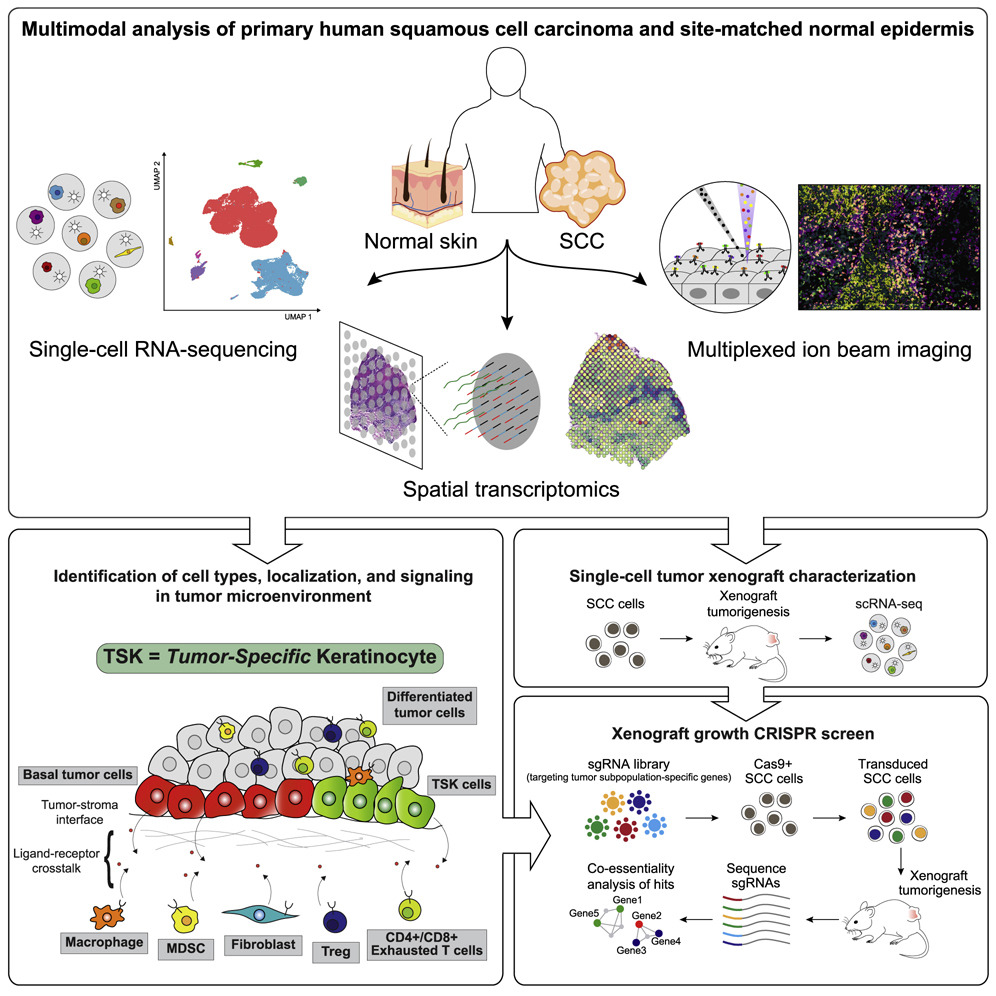
Multimodal Analysis of Composition and Spatial Architecture in Human Squamous Cell Carcinoma
Highlights
Profiling of 10 human skin SCCs and matched normals via scRNA-seq, ST, and MIBI
Tumor-specific keratinocytes (TSKs) reside within a fibrovascular niche at leading edges
Distinct ligand-receptor and spatial niche associations for tumor and stromal cells.
Subpopulation essential tumorigenic gene networks defined by in vivo CRISPR screening
Summary To define the cellular composition and architecture of cutaneous squamous cell carcinoma (cSCC), we combined single-cell RNA sequencing with spatial transcriptomics and multiplexed ion beam imaging from a series of human cSCCs and matched normal skin. cSCC exhibited four tumor subpopulations, three recapitulating normal epidermal states, and a tumor-specific keratinocyte (TSK) population unique to cancer, which localized to a fibrovascular niche. Integration of single-cell and spatial data mapped ligand-receptor networks to specific cell types, revealing TSK cells as a hub for intercellular communication. Multiple features of potential immunosuppression were observed, including T regulatory cell (Treg) co-localization with CD8 T cells in compartmentalized tumor stroma. Finally, single-cell characterization of human tumor xenografts and in vivo CRISPR screens identified essential roles for specific tumor subpopulation-enriched gene networks in tumorigenesis. These data define cSCC tumor and stromal cell subpopulations, the spatial niches where they interact, and the communicating gene networks that they engage in cancer(Ji et al. 2020).