Chapter 5 Research topic based
5.1 CNV calling
5.1.1 breaking point detection
- 4 CNV breakpoint detection methods (2021-07-17 Group meeting)
- CHISEL: https://www.nature.com/articles/s41587-020-0661-6#Sec8 (see global clustering subsection)
- seemingly no breakpoint detection, but rather a global clustering (ie. entry-wise for a bin-by-cell matrix), thus the resolution of CNV is the bin size (5MB)
- Alleloscope: https://www.nature.com/articles/s41587-021-00911-w#Sec10 (see segmentation subsection)
- HMM on a pooled cells (pseudo-bulk?) with pre-defined Gaussian means and variance for each state
- i6-HMM generates in silico spike-in; seemingly define CNV region (segment) on cluster instead of cell, but using noise model on each cell (not quite sure from the doc).
- KS test for whether to two neighbour bins should be joined, by using the posterior samples of Gamma-Poisson posterior. Seemingly using noise model on each cell within a cluster
FACLON https://academic.oup.com/nar/article/43/4/e23/2410993
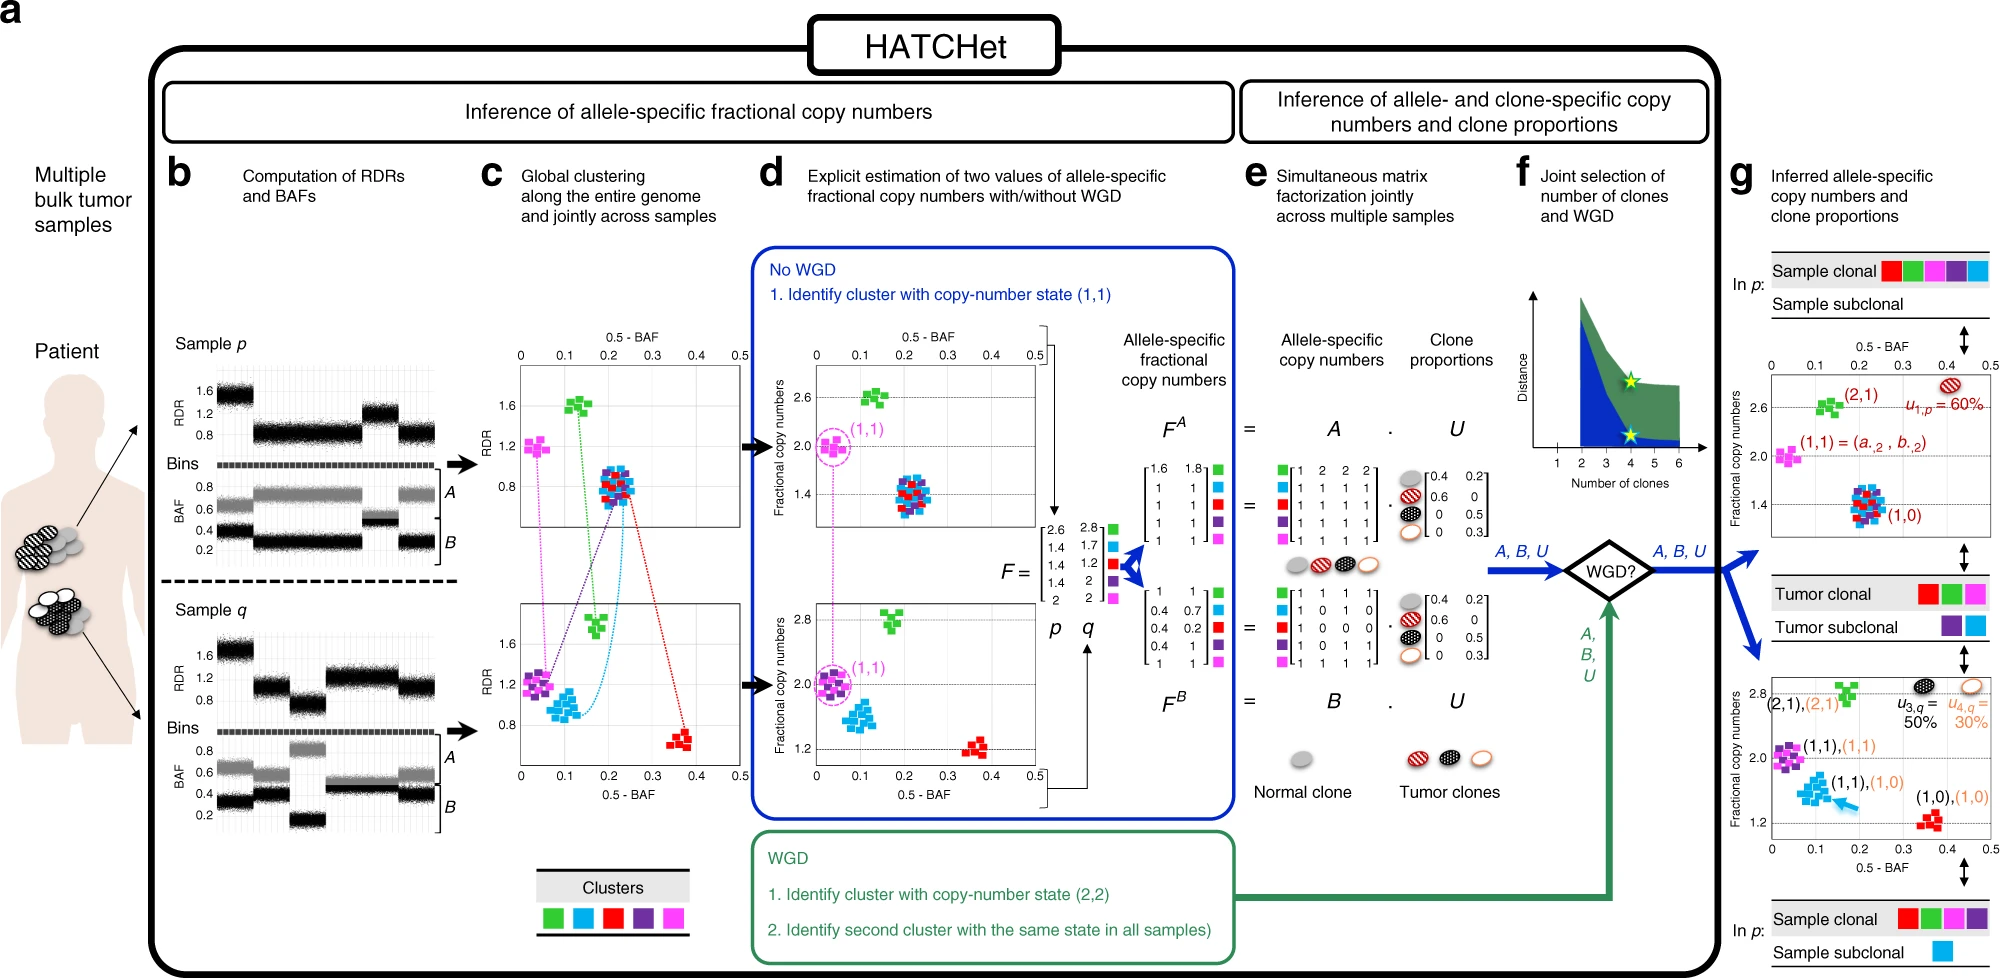
Overview of HATCHet algorithm
https://www.nature.com/articles/s41467-020-17967-y/figures/1
a HATCHet takes in input DNA sequencing data from multiple bulk tumor samples of the same patient and has five steps. b First, HATCHet calculates the RDRs and BAFs in bins of the reference genome (black squares). Here, we show two tumor samples p and q. c Second, HATCHet clusters the bins based on RDRs and BAFs globally along the entire genome and jointly across samples p and q. Each cluster (color) includes bins with the same copy-number state within each clone present in p or q. d Third, HATCHet estimates two values for the fractional copy number of each cluster by scaling RDRs. If there is no WGD, the identification of the cluster (magenta) with copy-number state (1, 1) is sufficient and RDRs are scaled correspondingly. If a WGD occurs, HATCHet identifies an additional cluster with identical copy-number state in all tumor clones. Dashed black horizontal lines in the scaled BAF-RDR plot represent values of fractional copy numbers that correspond to clonal CNAs. e Fourth, HATCHet factors the allele-specific fractional copy numbers FA, FB into the allele-specific copy numbers A, B, respectively, and the clone proportions U. Here, there is a normal clone and 3 tumor clones. f Last, HATCHet’s model-selection criterion identifies the matrices A, B, and U in the factorization while evaluating the fit according to both the inferred number of clones and presence/absence of a WGD. g HATCHet outputs allele- and clone-specific copy numbers (with the color of the corresponding clone) and clone proportions (in the top right part of each plot) for each sample. Clusters are classified according to the inference of unique/different copy-number states in each sample (sample-clonal/subclonal) and across all tumor clones (tumor-clonal/subclonal).
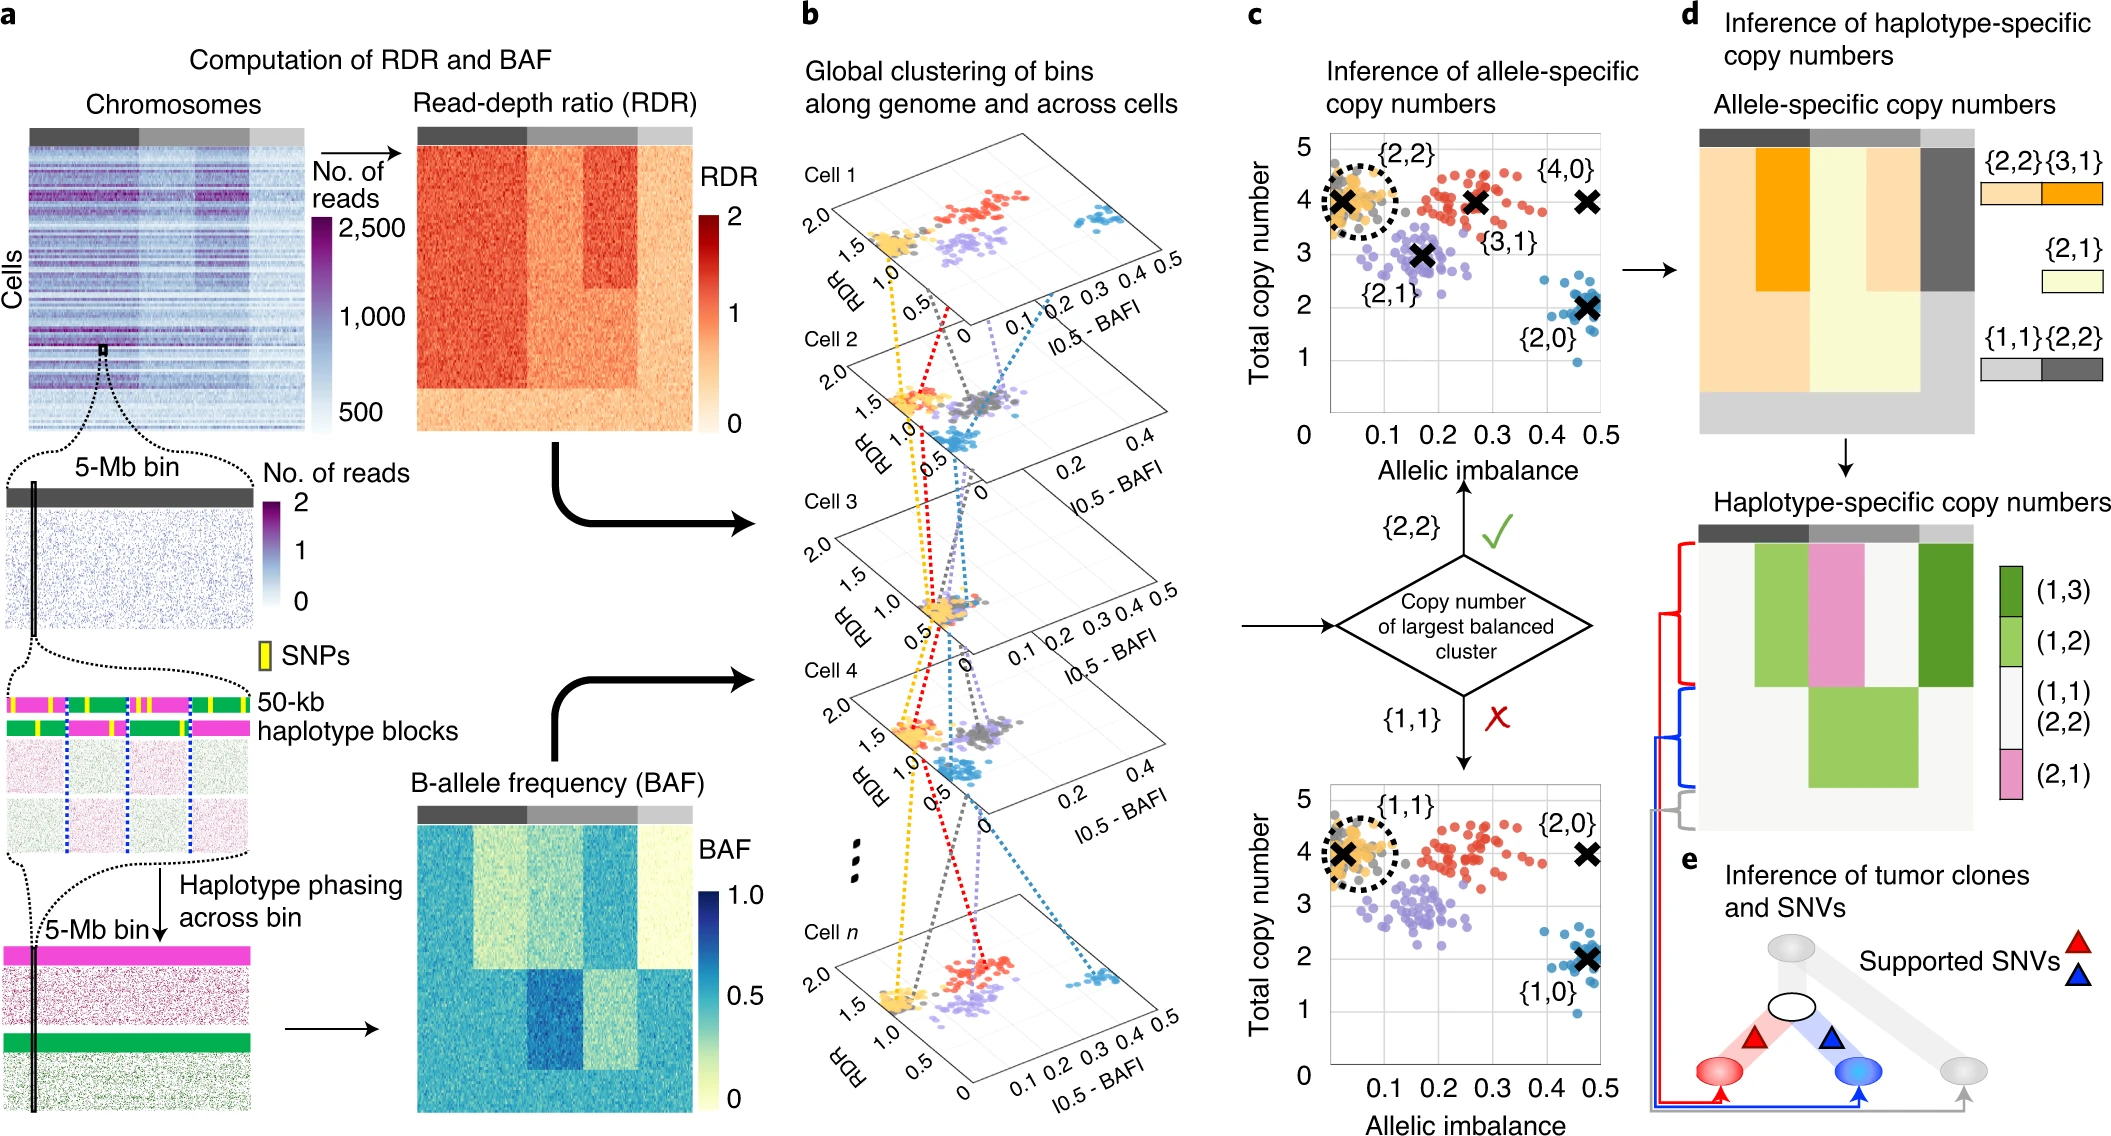
Overview of chisel algorithm
https://www.nature.com/articles/s41587-020-0661-6/figures/1
a, CHISEL computes RDRs and BAFs in low-coverage (<0.05× per cell) single-cell DNA sequencing data (top left). Read counts from 2,000 individual cells (rows) in 5-Mb genomic bins (columns) across three chromosomes (gray rectangles in first row) are shown. For each bin in each cell, CHISEL computes the RDR (top) by normalizing the observed read counts. CHISEL computes the BAF in each bin and cell (bottom) by first performing referenced-based phasing of germline SNPs in 50-kb haplotype blocks (magenta and green) and then phasing all these blocks jointly across all cells. b, CHISEL clusters RDRs and BAFs globally along the genome and jointly across all cells resulting here in five clusters of genomic bins (red, blue, purple, yellow and gray) with distinct copy-number states. c, CHISEL infers a pair {c^t,cˇt} of allele-specific copy numbers for each cluster by determining whether the allele-specific copy numbers of the largest balanced (BAF of ~0.5) cluster are equal to {1, 1} (diploid), {2, 2} (tetraploid) or are higher ploidy. d, CHISEL infers haplotype-specific copy numbers (at, bt) by phasing the allele-specific copy numbers {c^t,cˇt} consistently across all cells. e, CHISEL clusters tumor cells into clones according to their haplotype-specific copy numbers. Here, a diploid clone (light gray) and two tumor clones (red and blue) are obtained. A phylogenetic tree describes the evolution of these clones. Somatic SNVs are derived from pseudo-bulk samples and placed on the branches of the tree.
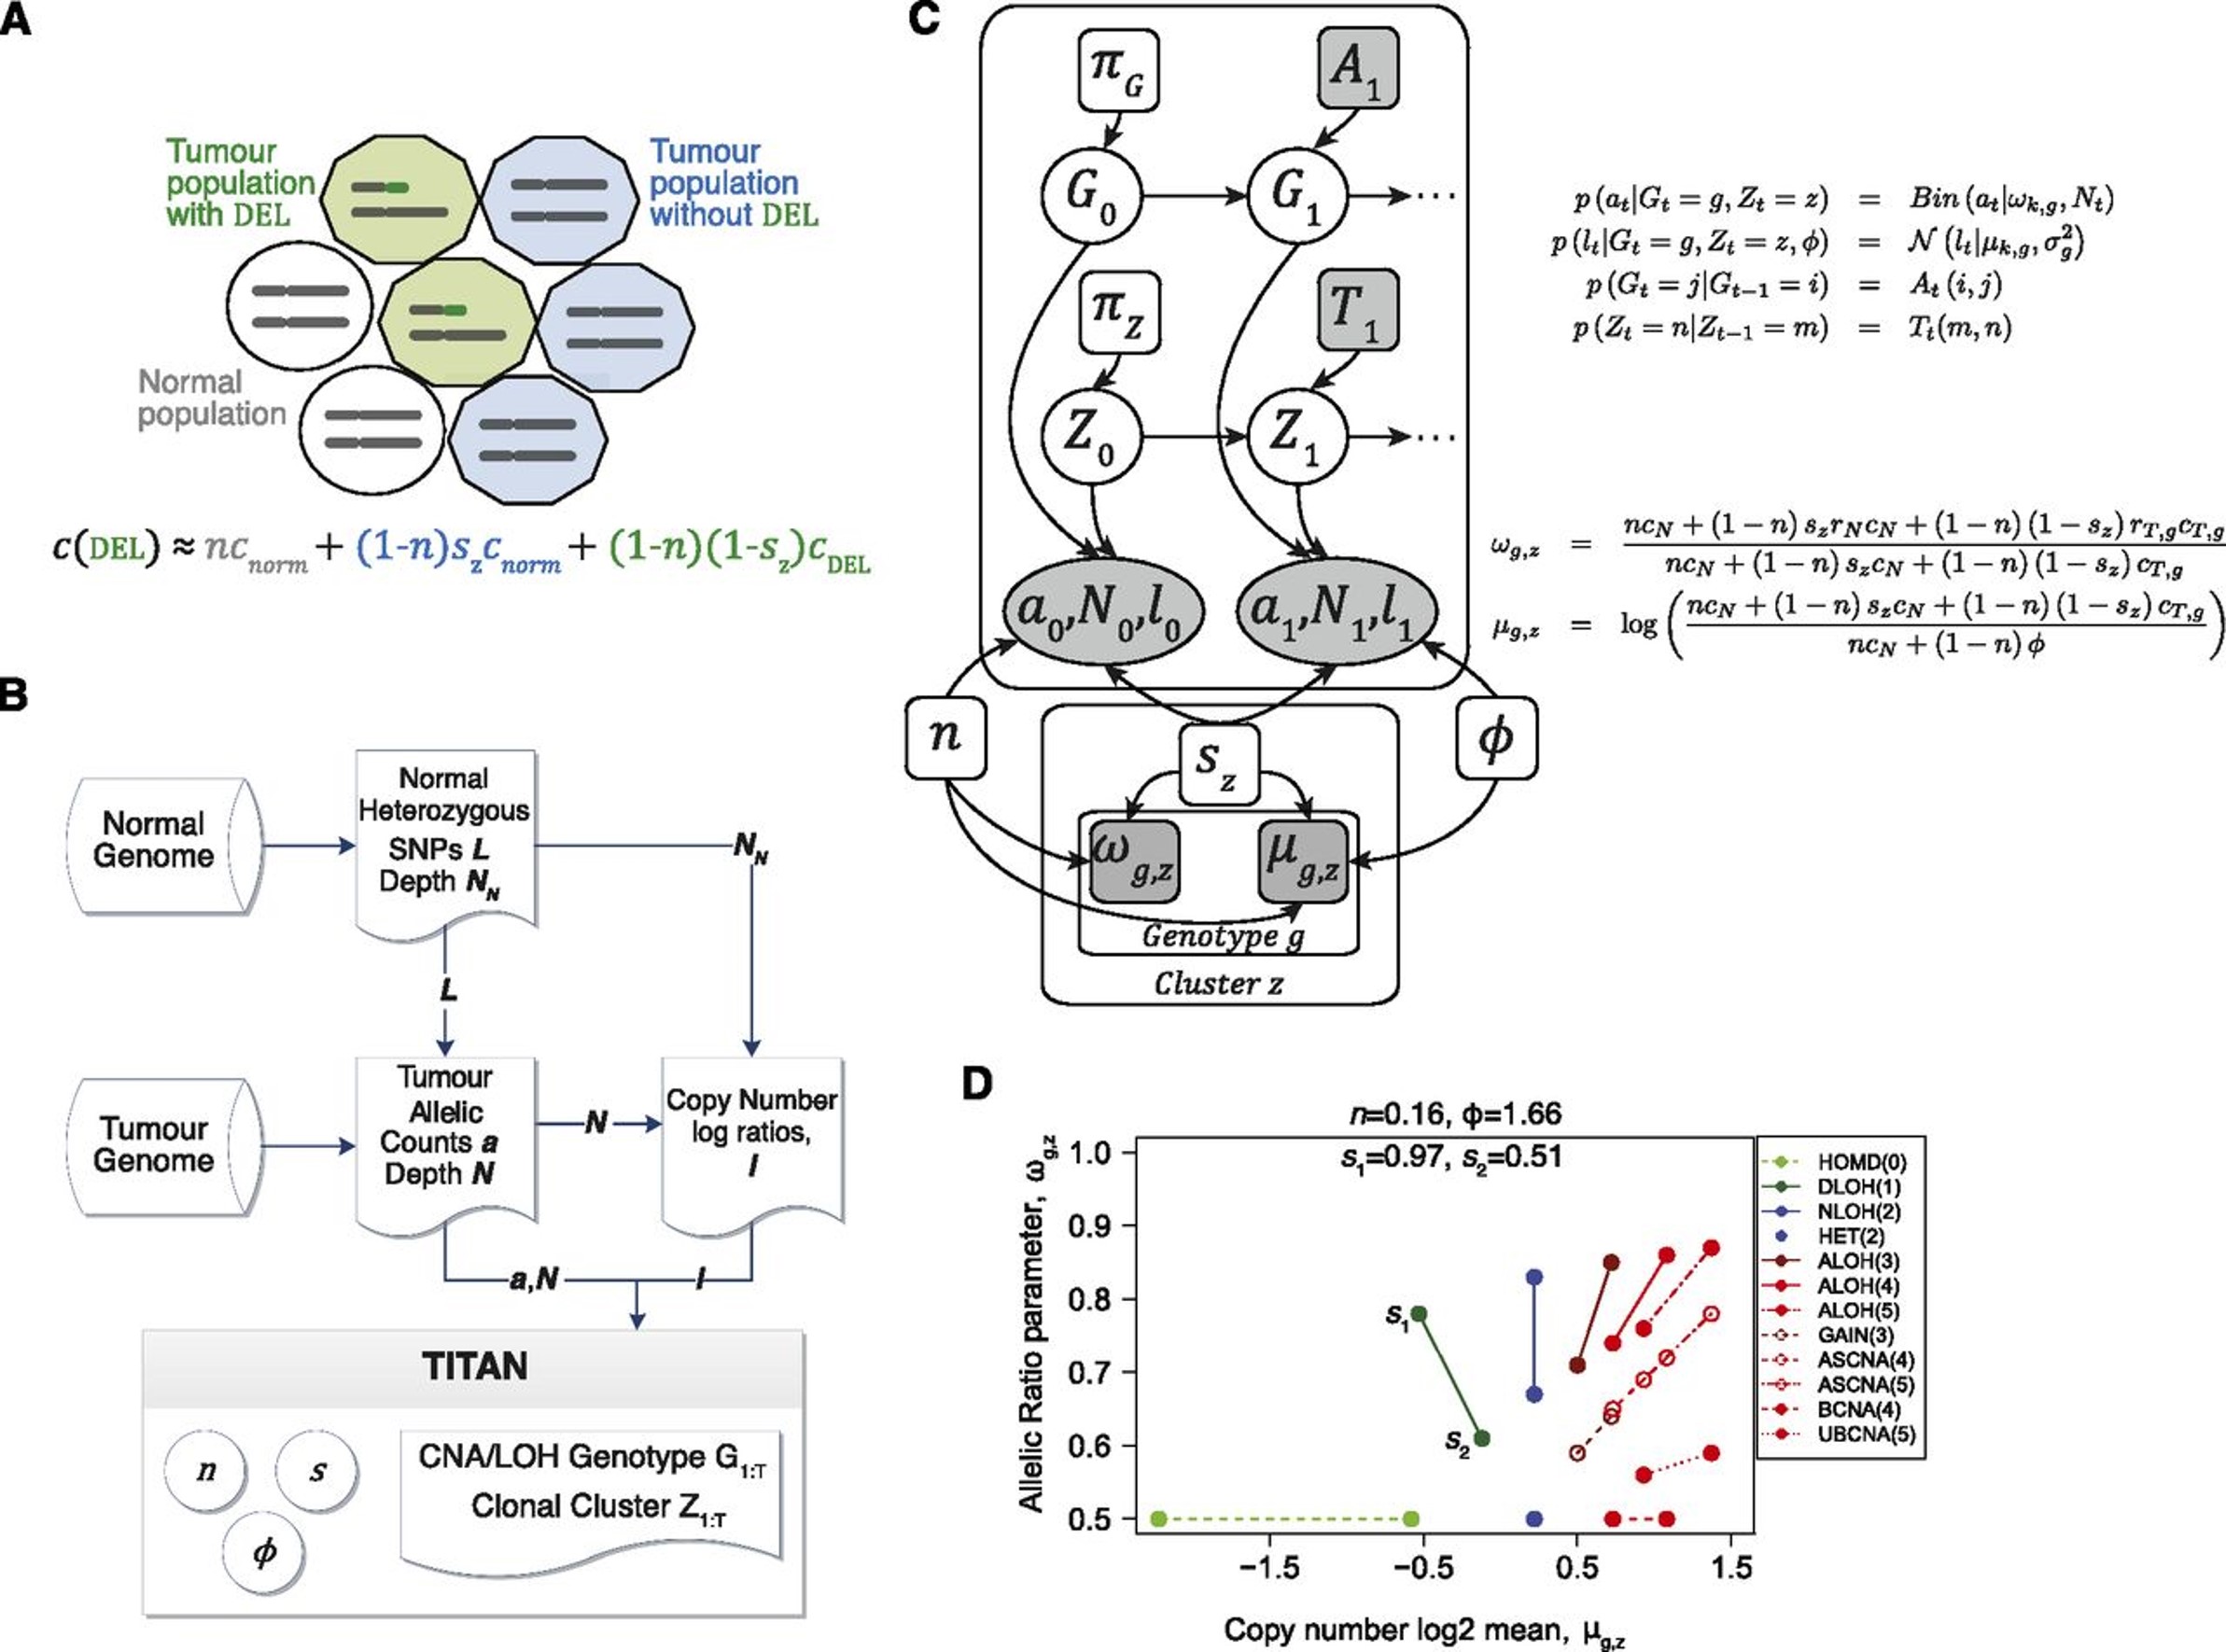
Overview of TITAN local clustering for segemetation
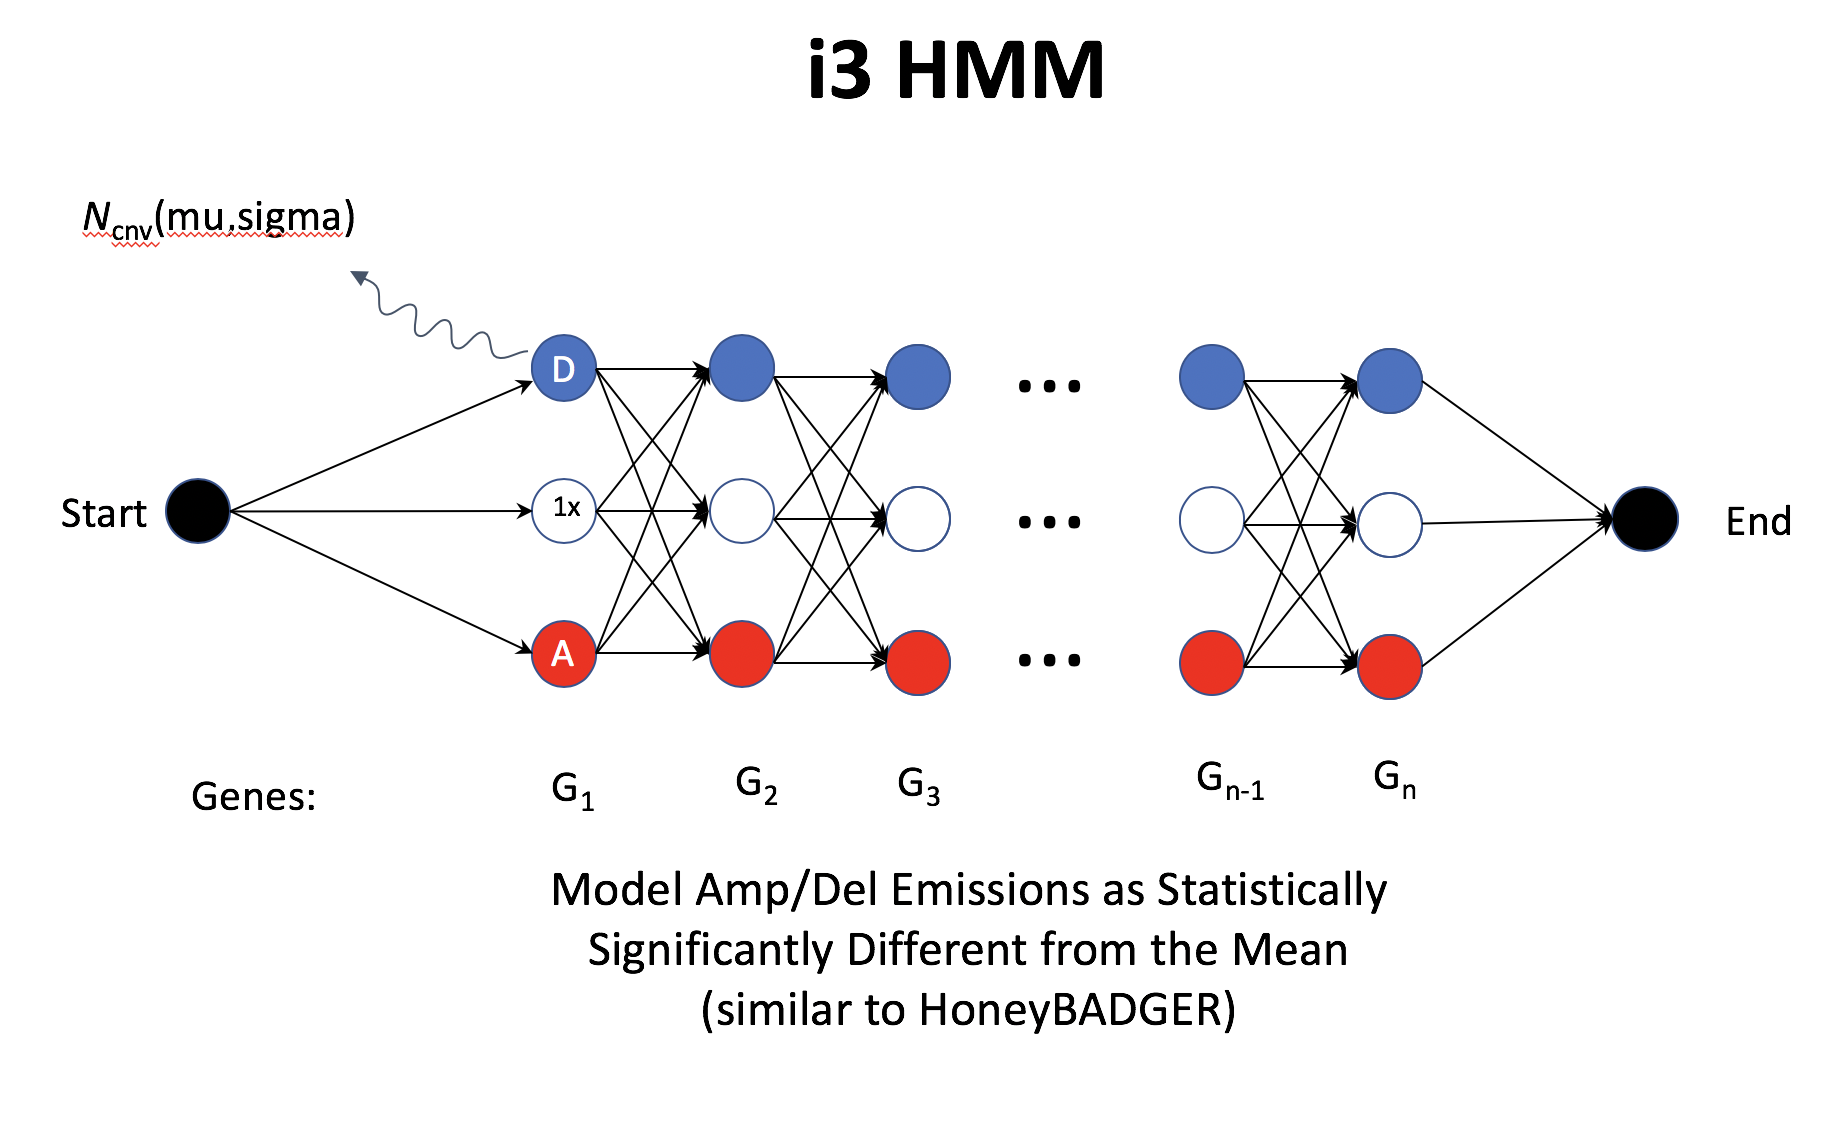
Overview of inferCNV i3HMM
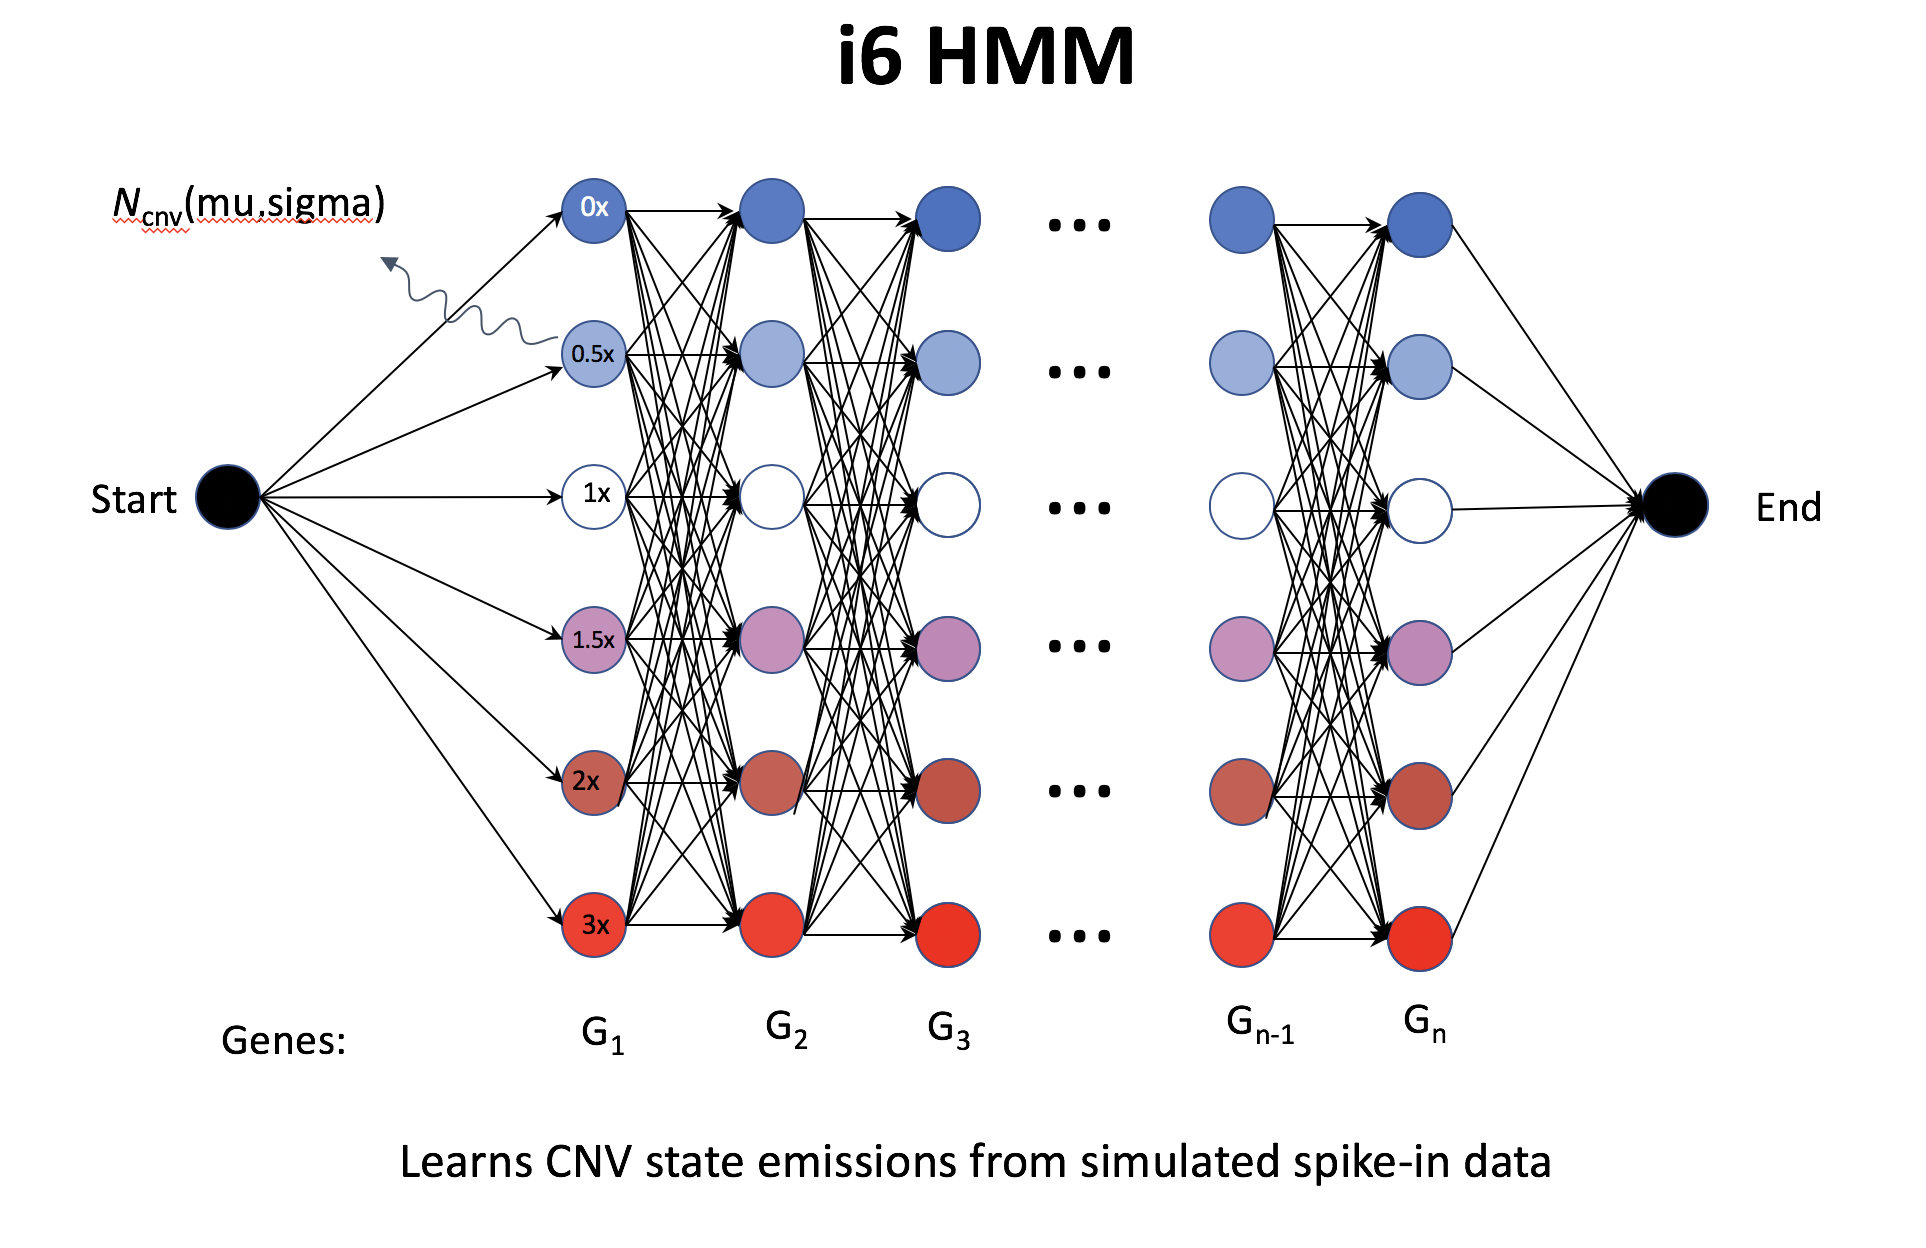
Overview of inferCNV i6HMM

Overview of HoneyBADGER method
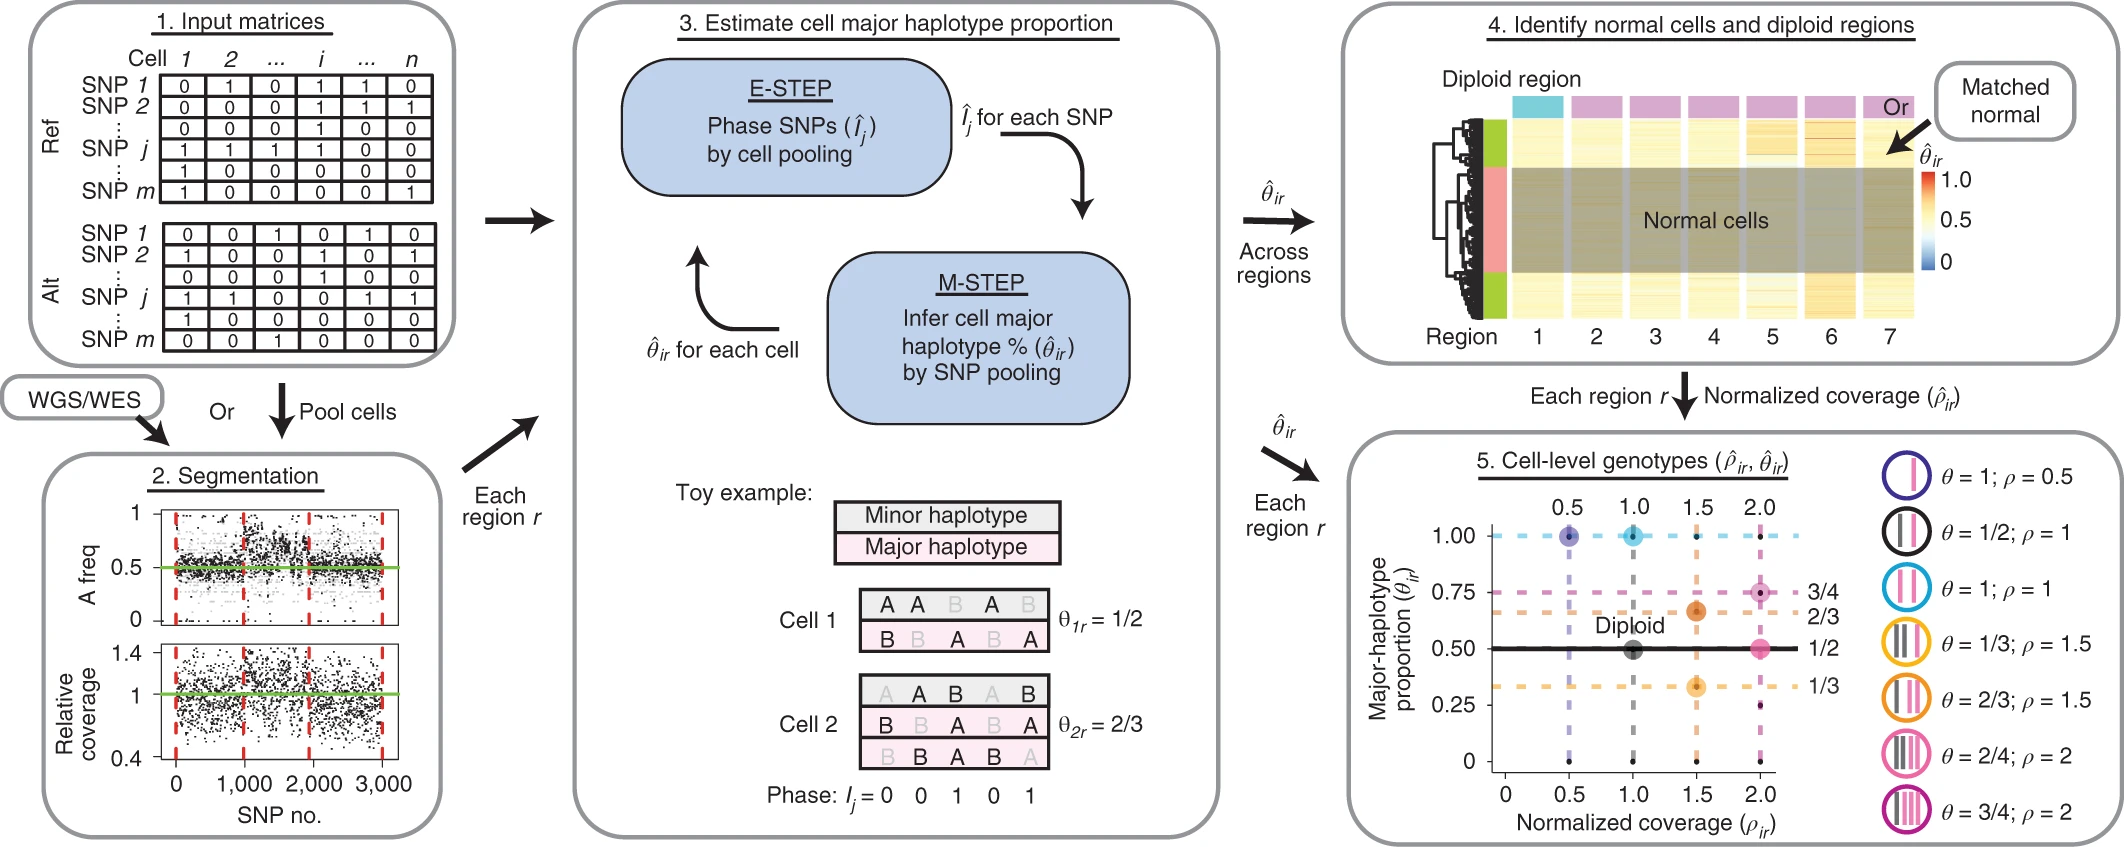
Overview of Alleloscope algorithm
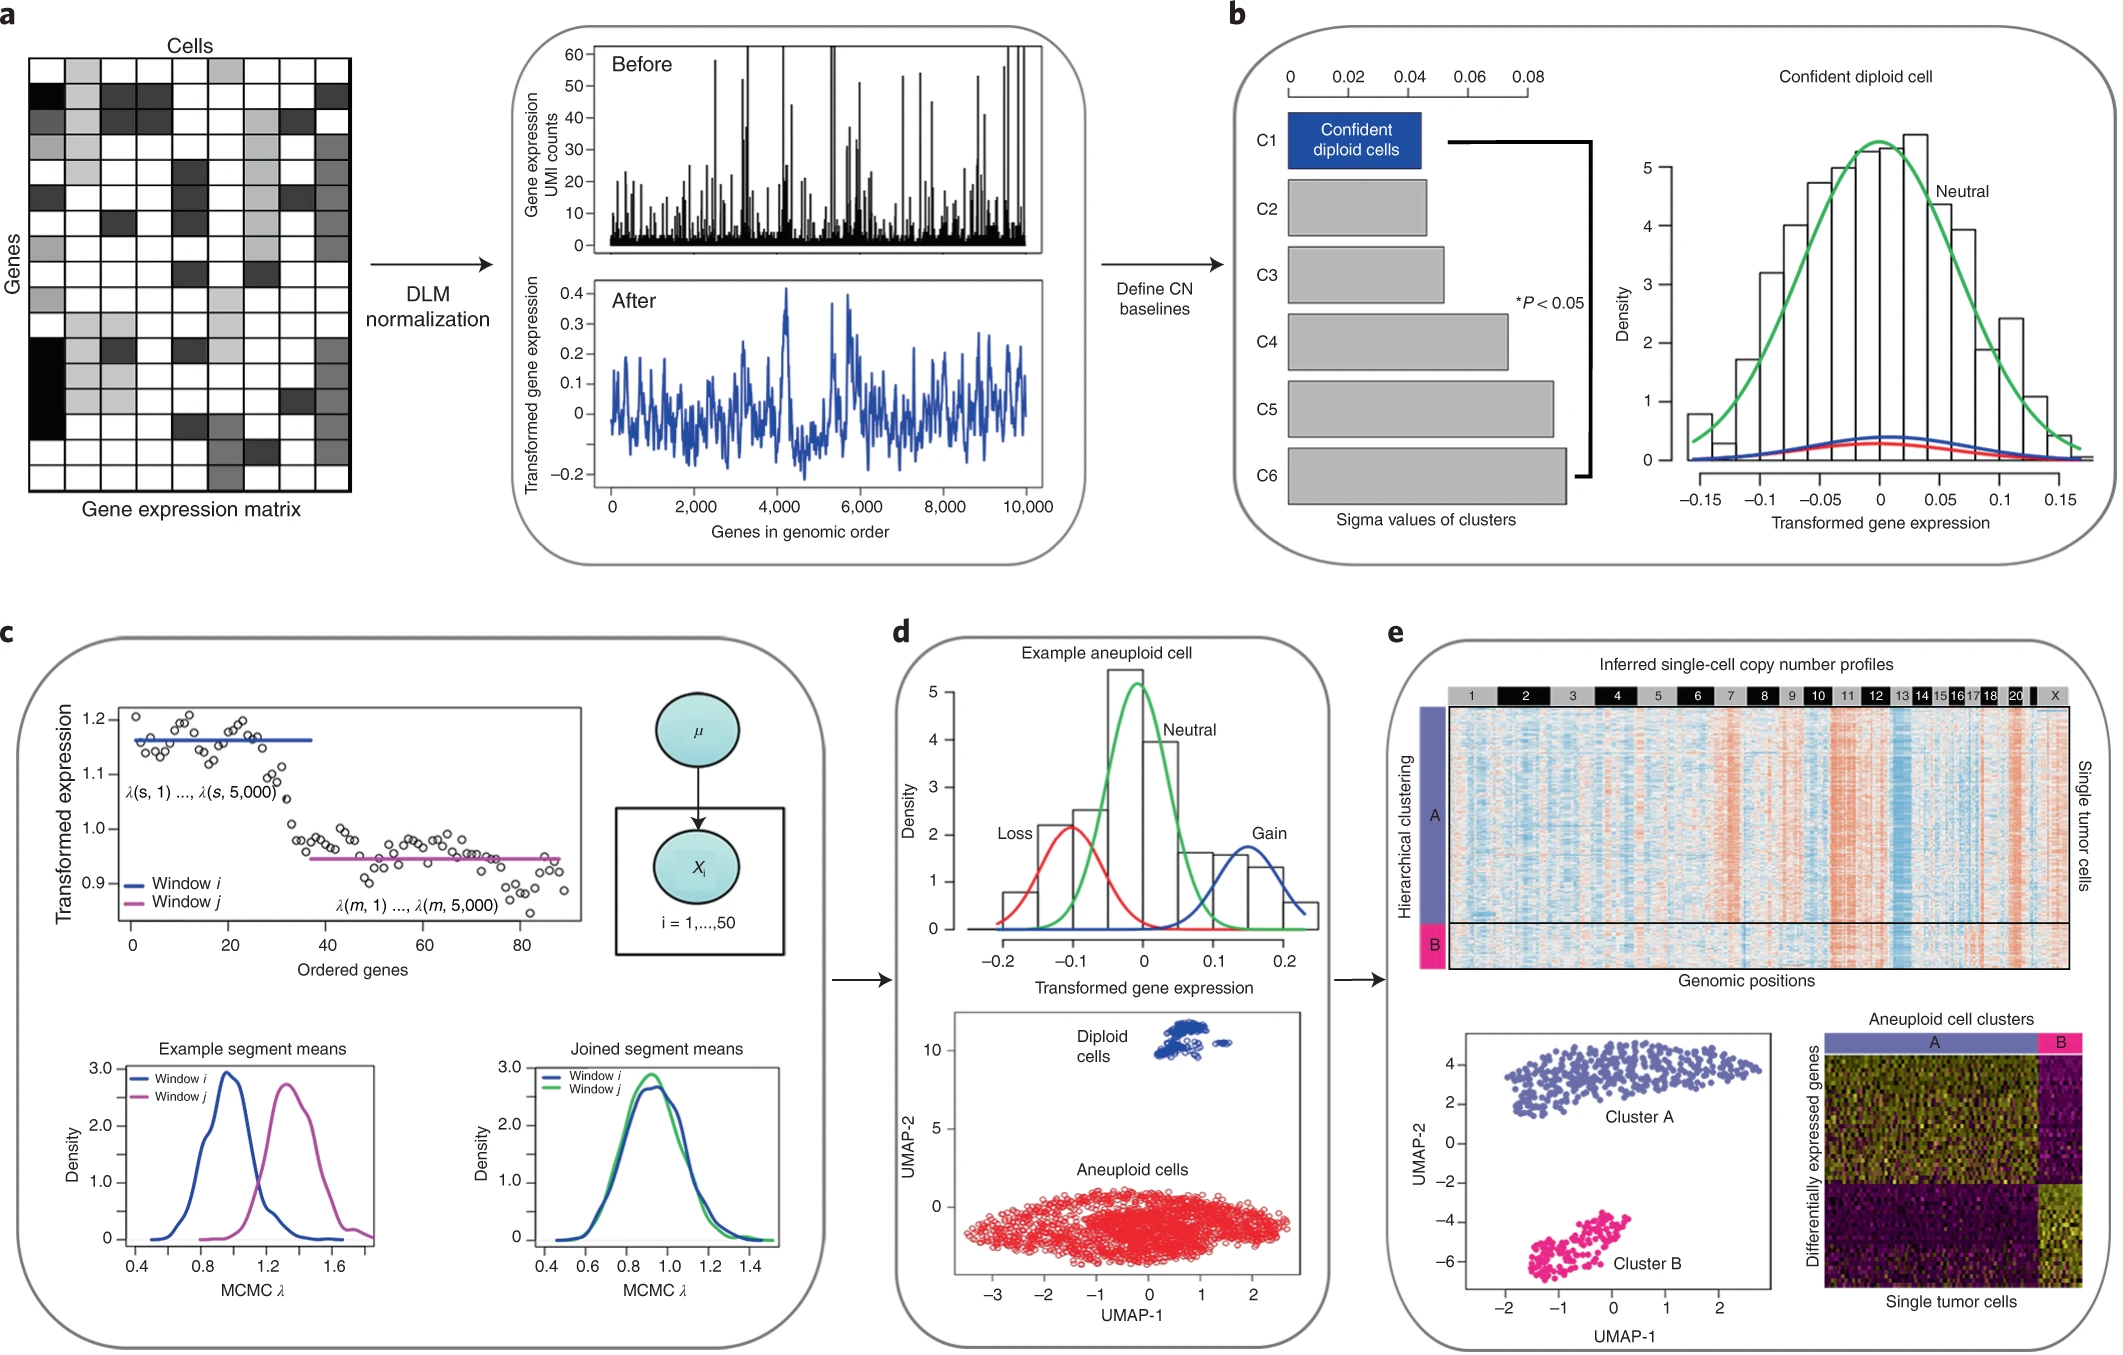
Overview of copykat algorithm
5.1.4 PUBMON
Precise identification of cancer cells from allelic imbalances in single cell transcriptomes
this paper used BAF information to identify cancer cells, seems quite relevant.
2022-03-09
Evolutionary tracking of cancer haplotypes at single-cell resolution
Haplotype-enhanced inference of somatic copy number profiles from single-cell transcriptomes
Numbat
introduction
Existing approaches for CNV detection from scRNA-seq do not utilize the prior knowledge of haplotypes, or the individual-specific configuration of variant alleles on the two homologous chromosomes, which can enable more sensitive detection of allelic imbalance.
The utility of phasing in detecting CNV signals from scRNA-based assays, however, has not been explored.
We therefore developed a computational method, Numbat, which integrates expression, allele, and haplotype information derived from population-based phasing to comprehensively characterize the CNV landscape in single-cell transcriptomes.
Numbat does not require sample-matched DNA data or a priori genotyping, and is widely applicable to a wide range of experimental settings and cancer types.
- Results
Enhanced detection of subclonal allelic imbalances using population-based haplotype phasing
Prior phasing information can effectively amplify weak allelic imbalance signals of individual SNPs induced by the CNV, by exposing joint behavior of entire haplotype sequences and thereby increasing the statistical power.
The ability to infer phasing between genes is particularly useful for CNV inference, as it provides means to overcome stochastic allele-specific expression effects which give rise to bursts of gene-specific allelic imbalances in individual cells.
The differential phasing accuracy from within and between genes reflects the fact that the strength of genetic linkage decays with increasing distance (Supplementary Figure 1a).
To reflect the decay in phasing strength over longer genetic distances, we introduced site-specific transition probabilities between haplotype states in the Numbat allele HMM (see Methods).
Accurate copy number inference from single-cell transcriptomes
To increase robustness, Numbat models gene expression as integer read counts using a discrete Poisson Lognormal mixture distribution, and accounts for excess variance in the allele frequency (e.g. due to allele-specific detection or transcriptional bursts) using a Beta-Binomial distribution.
Iterative strategy to decompose tumor clonal architecture
Reliable identification of cancer cells in the tumor microenvironment
Allele-specific CNV analysis reveals additional subclonal complexity
Unraveling the interplay between genetic and transcriptional heterogeneity in tumor evolution
Discussion
Methods
5.3 Deconvolution
5.3.1 Deconvolution of bulk tissue and spatial transcriptomic data
Related papers are as follows:
From xiunan’s pre
Reference-free cell-type deconvolution of pixel-resolution spatially resolved transcriptomics data
Yuanhua add
5.5 Spatial transcriptomics
- 202109 Read in depth (lead by xianjie)
The spatial landscape of clonal somatic mutations in benign and malignant tissue(Erickson et al. 2021)
Keywords: CNV
Multimodal analysis of composition and spatial architecture in human squamous cell carcinoma(Zhang et al. 2021)
Keywords: alignment of scRNA AND ST
- 2022 spatial and CNV
Statistical and machine learning methods for spatially resolved transcriptomics data analysis(Zeng et al. 2022)
STARCH: copy number and clone inference from spatial transcriptomics data(Elyanow et al. 2021)
The spatial landscape of clonal somatic mutations in benign and malignant tissue(Erickson et al. 2021)
Keywords: spatial; CNV
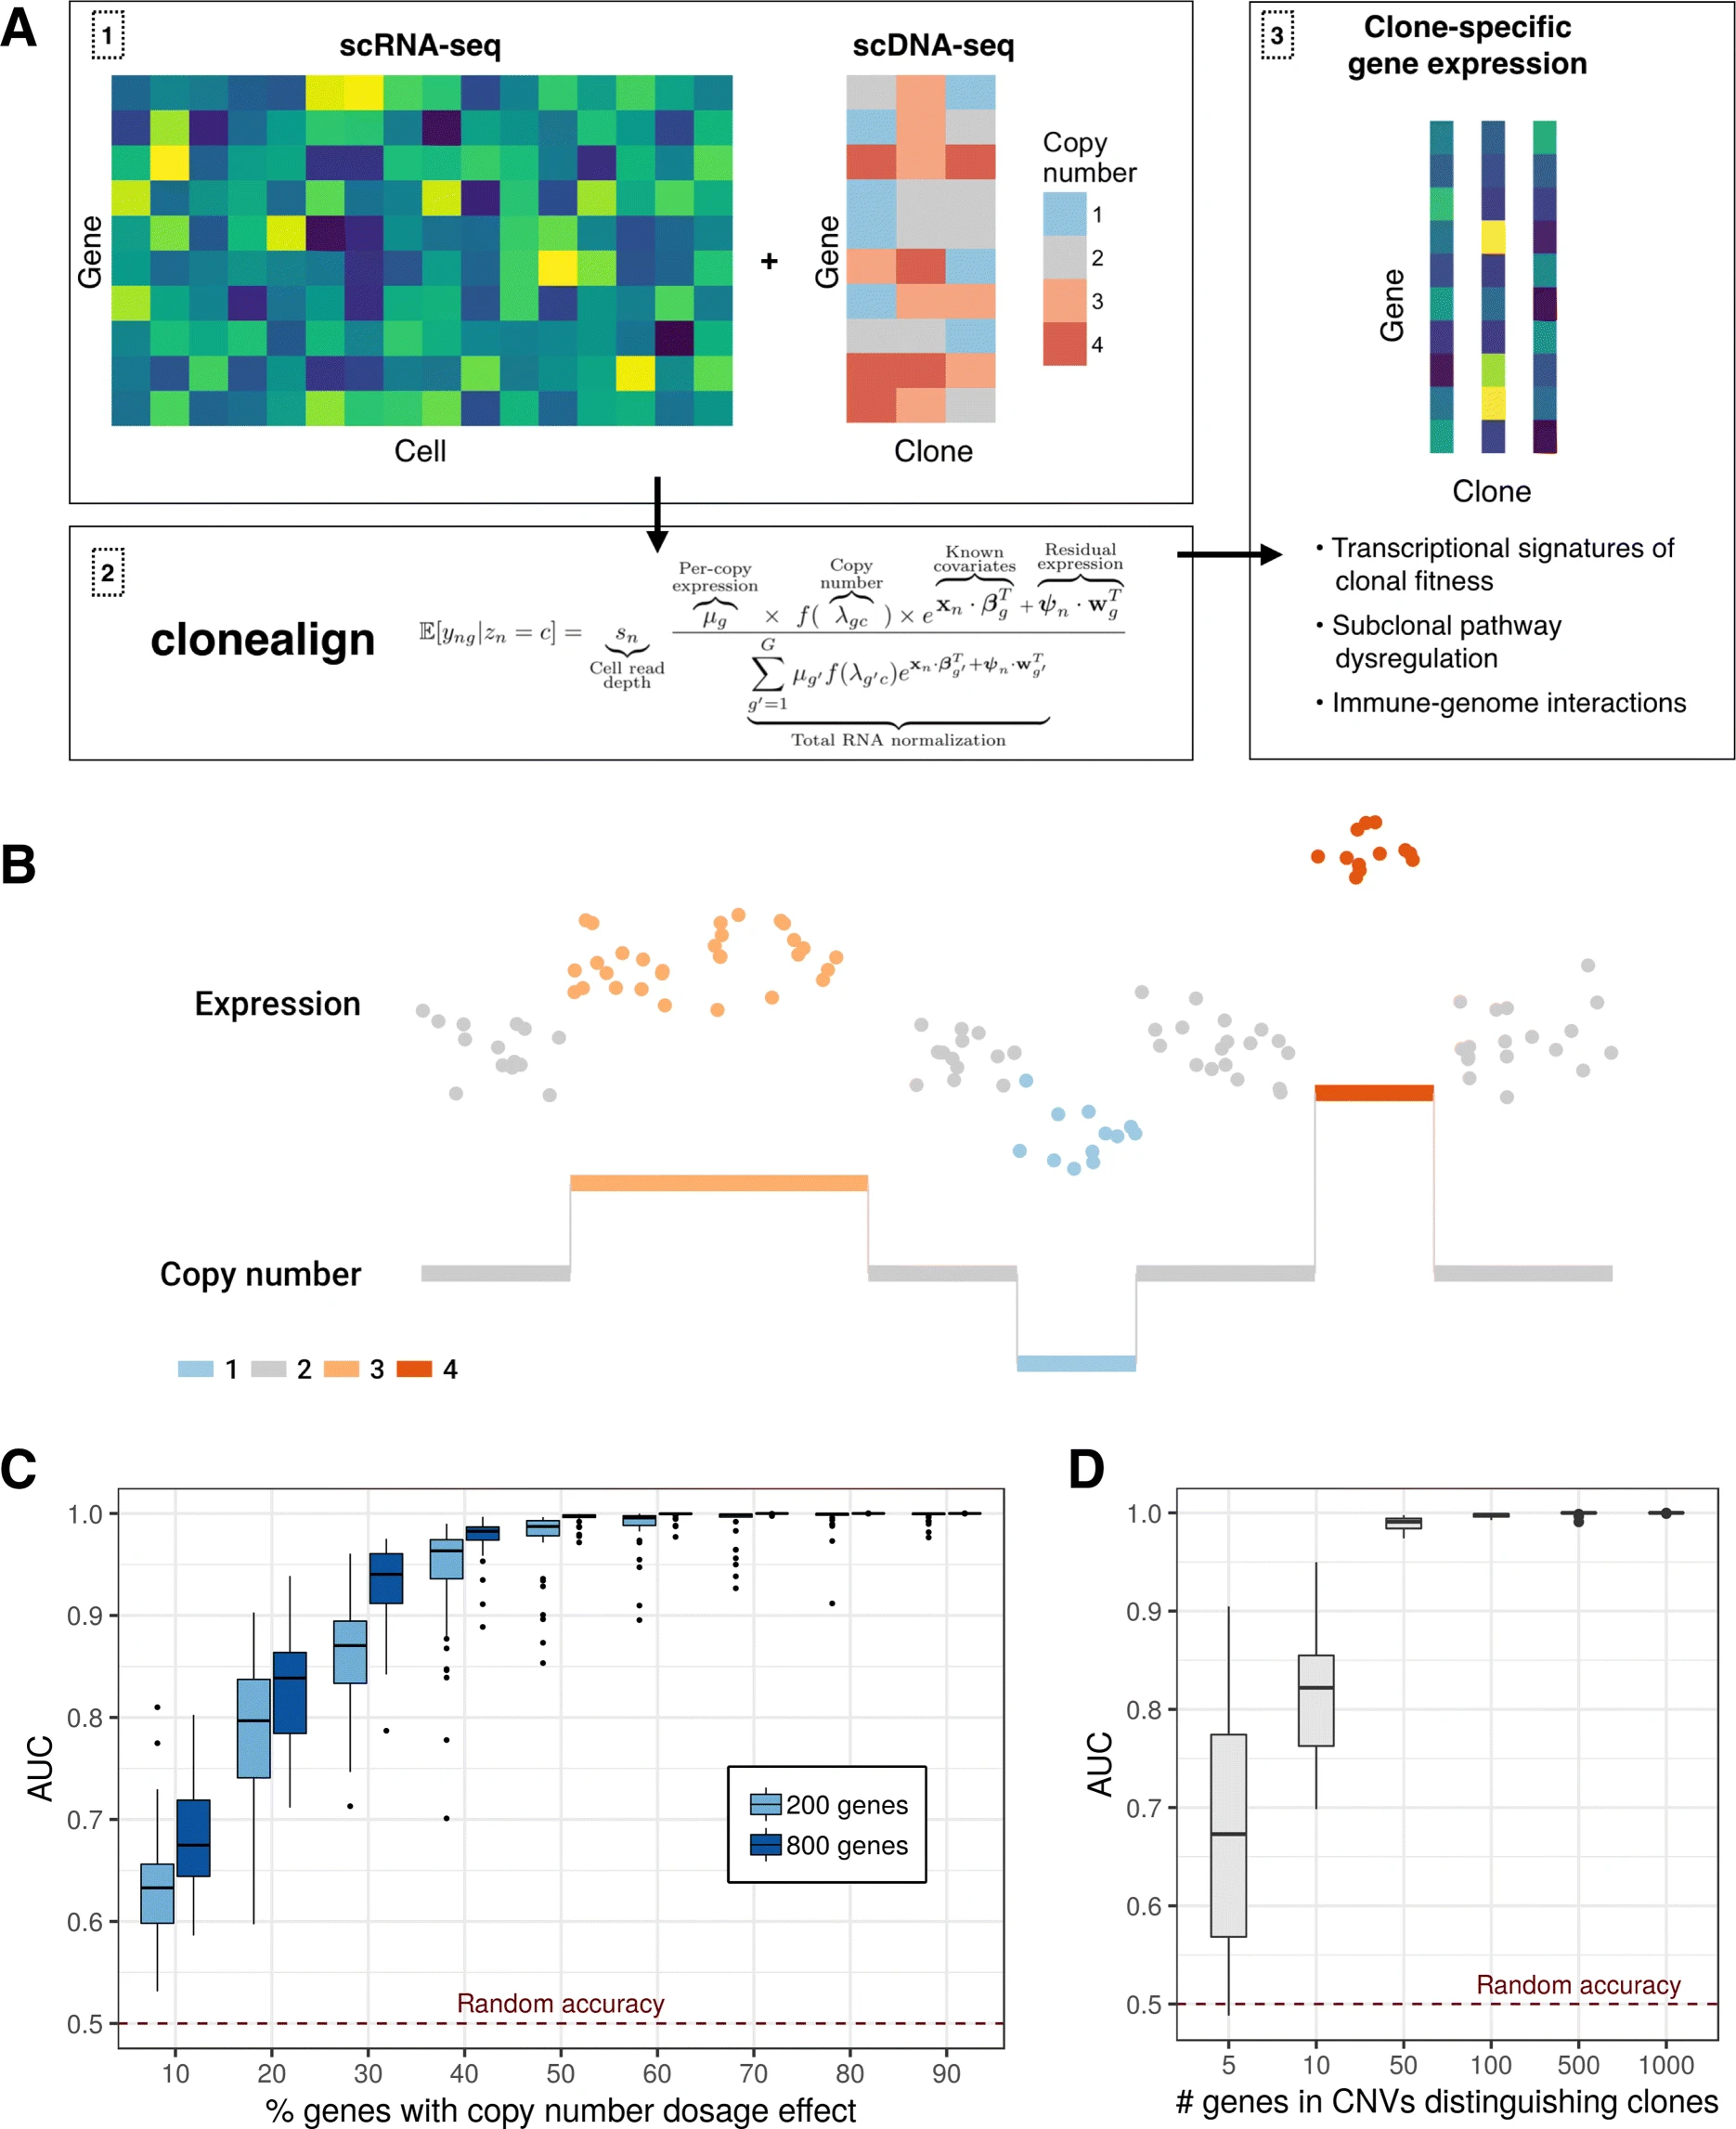 In order to relate the independent measurements, we assume that an increase in the copy number of a gene will result in a corresponding increase in that gene’s expression and vice versa (Fig. 1b)
a relationship previously observed in joint RNA-DNA assays in bulk tissues [12] and at the single-cell level [9, 10, 13].